Did You Know?
The most common way to get to the “MRC Zone Reporting” is to click on the “Zone” value within another report. Including the “Scan List” page.
Even if the Zone is showing as “unclassified” (the default if no Zone is provided), clicking it will get you into the report and you can change the Zone, outlined below.
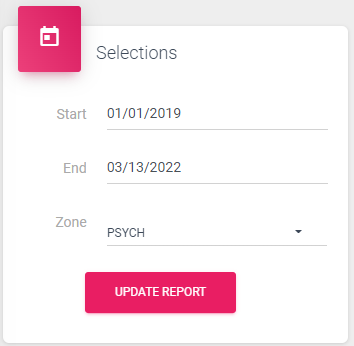
Here you will see the reporting for a particular Zone for the period of the report.
Within the “MRC Zone Reporting” you will have the option to report by day for each Zone.
This combines the usual Date Range selection with a Zone selection dropdown.
You can change dates by clicking in the field next to the date you want to change, then selecting a new date from the calendar, or typing the new date in manually.
After updating the dates, and selecting the Zone, click “Update Report”.
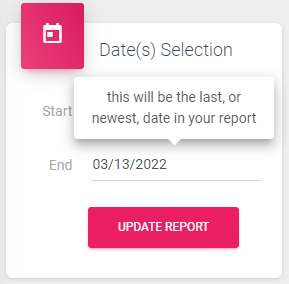
Notice, too, that when hovering your mouse, or clicking the field brings up a tooltip to help explain the purpose of the field. This is present in most locations around the system and products.
989
Various reports will include a daily view within MRC. Below are a couple of the charts that you will come across when looking at reports that include the daily, aggregated, view.
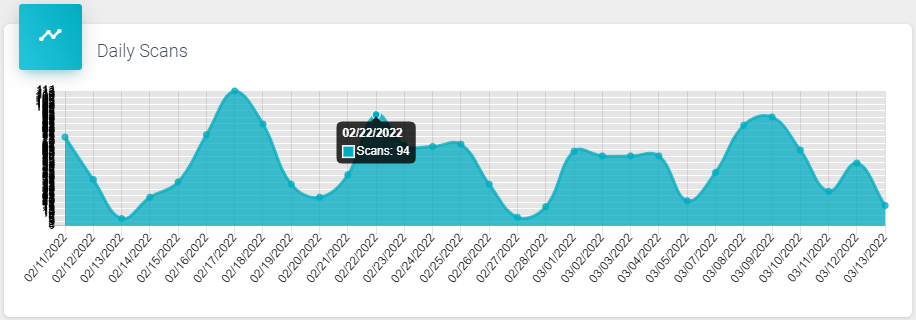
The first chart is the “Daily Scans”.
This is the number scans done by day for the period of the report.
Hovering over a datapoint will bring up the quantity of “Scans” for that date.
The next chart we will explore is the “Daily Tasks: Sat vs UnSat”.
This chart shows the daily Tasks that were completed for “Sat”, or Satisfactory, shown in Green, and “UnSat”, or Unsatisfactory, shown in Red.
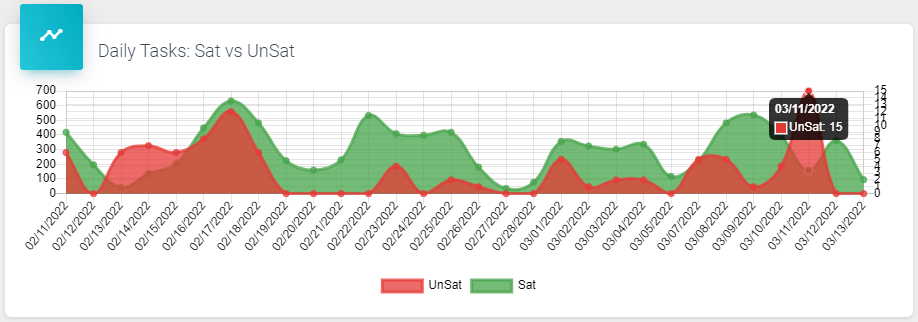
Again, hovering over the datapoint will display the details of the information represented.
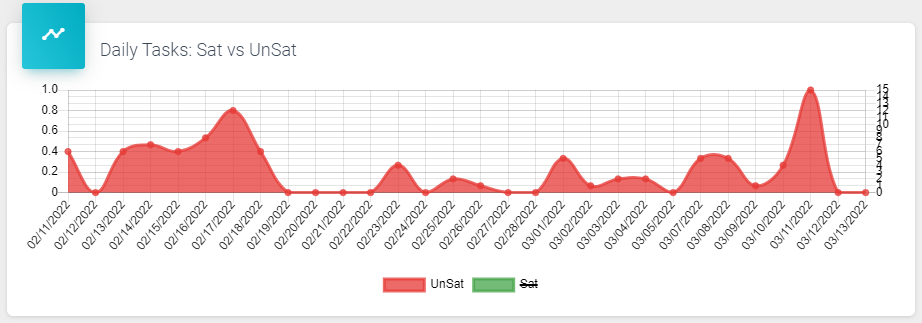
Also, represented in the chart is the Legend showing what each color represents. Try clicking “Sat” or “UnSat” to see the chart filtered.
Note that this is a feature across any report that includes a Legend. 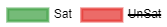
1003
Top 10 is a pretty common part of reporting to help surface information of interest.
Here we are looking at the “Top 10 Users” bar chart.
This represents the Users who have completed the most Scans for the period of the report.
Hovering over the bar chart will display the User and the exact number of Scans they completed.
971
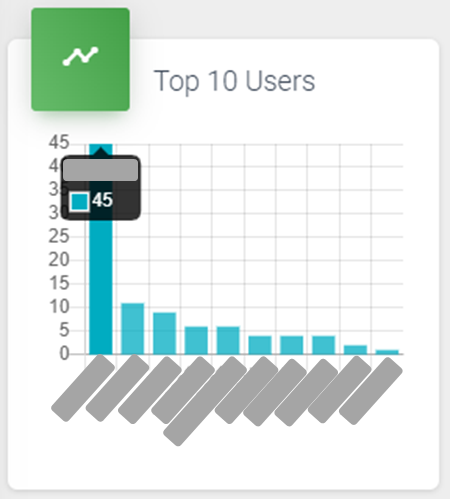
The area labeled “MRC Records for…” followed by a single date, or a date range, displays the aggregate information for each Scan completed for the period of the report.
Here is a definition of each of the fields, or columns, that appear in this table of information:
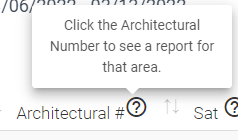
Here is a tip for using this table, and numerous other tables, within the system.
Try hovering your mouse over the question mark icon,  . A tooltip will appear to help let you know what else you can do from there.
975