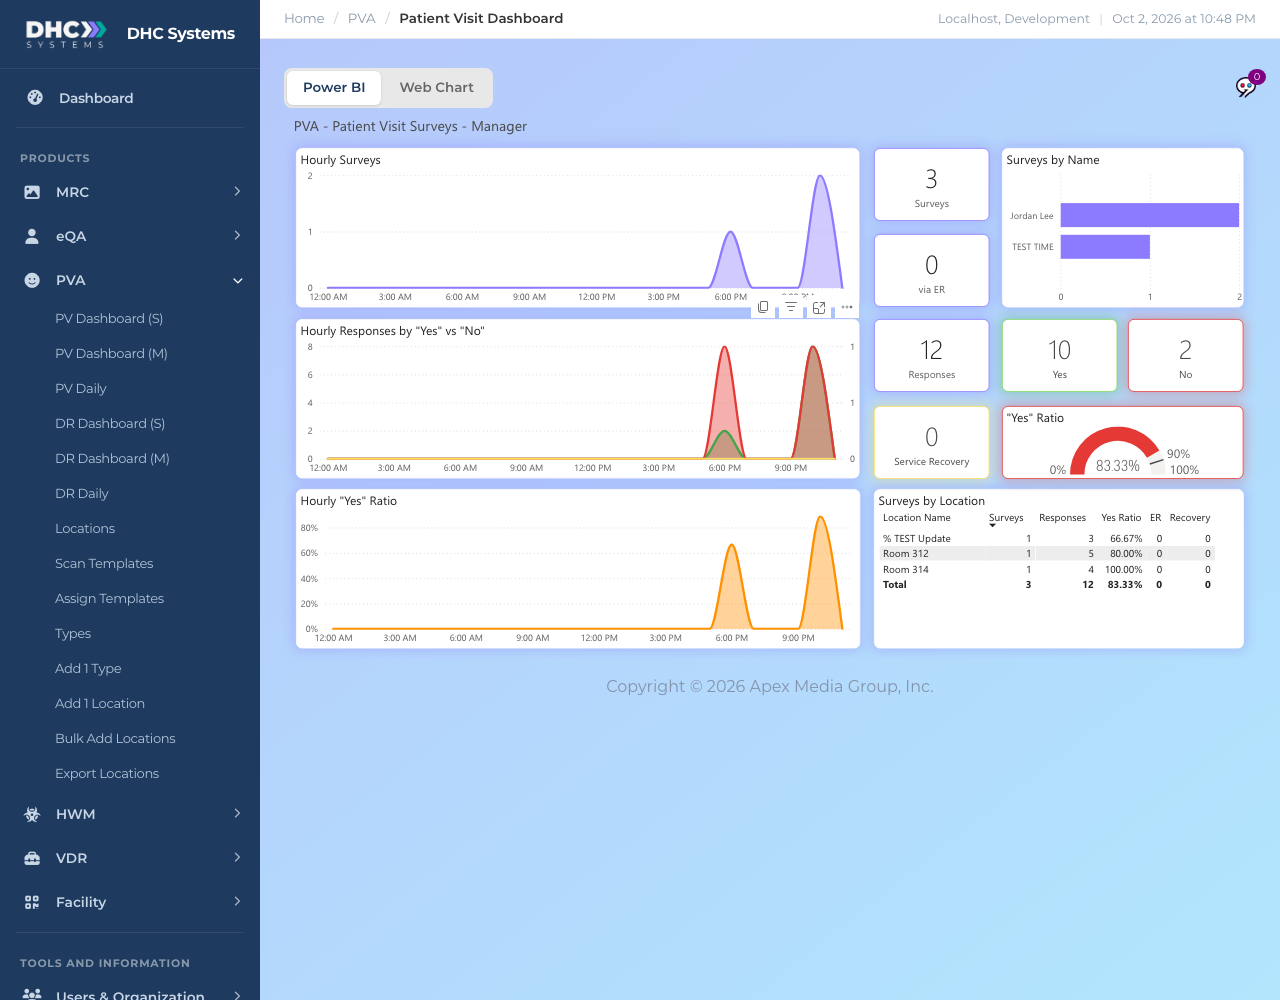
PV Dashboard (M) is the manager’s version of today’s patient visit picture. It has everything on the (S) page plus who completed the surveys and which rooms they covered, so you can see coverage and spot a room or a person that needs a word before the day is out.
The manager view adds names and locations
How to open it
In the sidebar click PVA, then PV Dashboard (M).
Give it a few seconds to draw.
What is on the page
Hourly Surveys, Hourly Responses by “Yes” vs “No” and Hourly “Yes” Ratio: today by hour. The third chart shows the Yes share for each hour, so a dip tells you when the answers turned negative.
Surveys, via ER, Responses, Yes, No, Service Recovery, “Yes” Ratio: the same totals as the (S) page. See “PV Dashboard (S)” for what each means.
Surveys by Name: a bar per person, using the Completed By Name typed on the phone. Longest bar did the most surveys today.
Surveys by Location: a table with one row per room scanned today: Location Name, Surveys, Responses, Yes Ratio, ER (surveys answered Yes to the ER question) and Recovery (surveys answered Yes to the service recovery question), with a Total row at the bottom. Click a column heading to sort.
Who can do this
M1 accounts and Directors (M2). Workers (IC) do not see this link.
Tips
Sort Surveys by Location by Yes Ratio to bring the weakest rooms to the top.
Names are typed by hand on the phone, so “J. Lee” and “Jordan Lee” show as two bars. Agree on one way of writing names with your team.