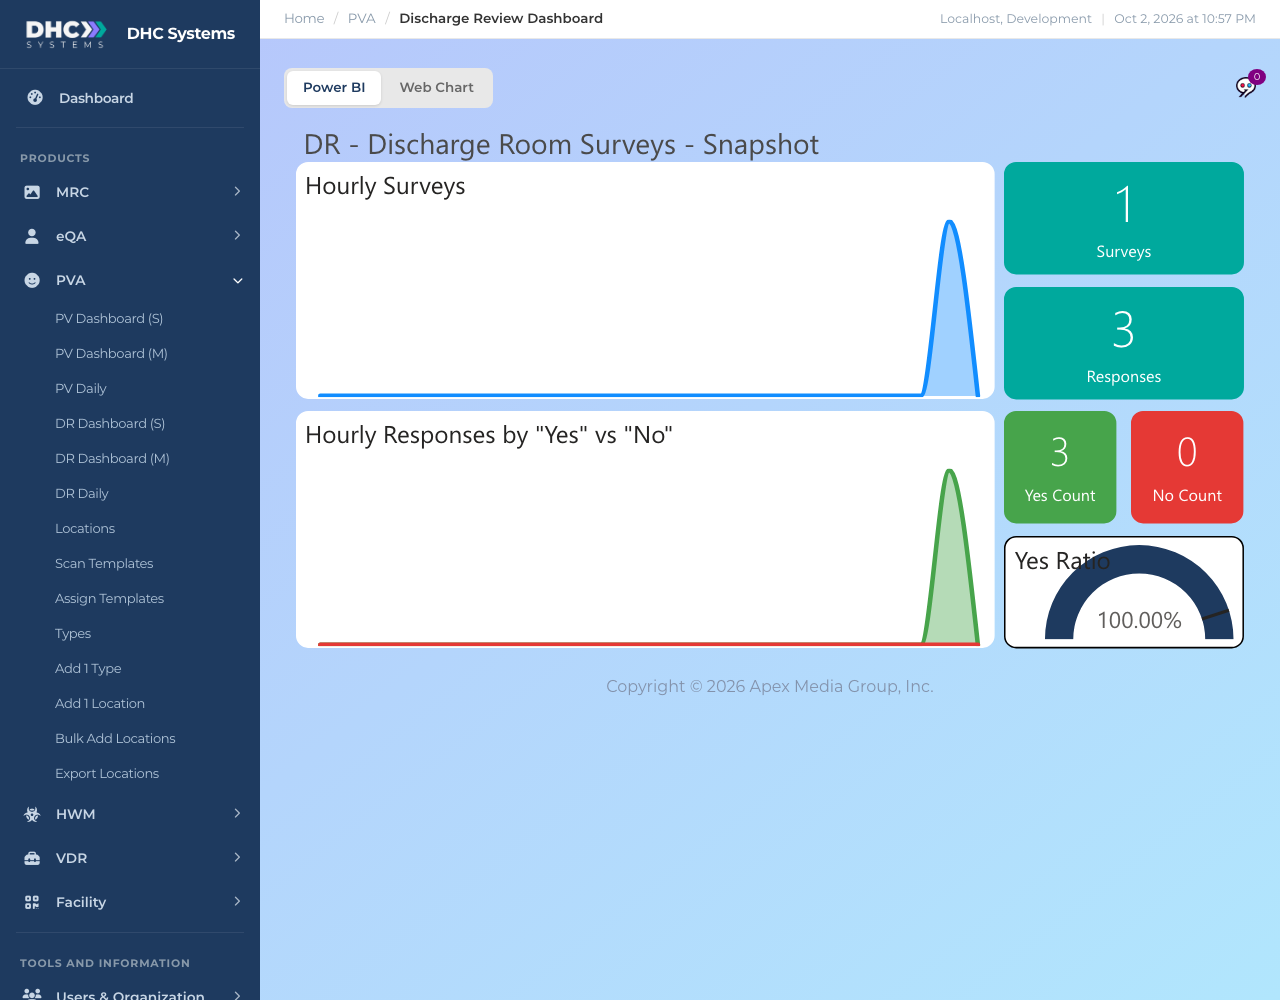
DR Dashboard (S) is the one page view of today’s discharge checks. It shows how many rooms have been checked after discharge today, when, and how many checklist items came back Yes. Every account type can open it.
Today’s discharge checks for the whole company
How to open it
In the sidebar click PVA, then DR Dashboard (S).
Wait a few seconds for the report to draw. Leave the toggle on Power BI.
What is on the page
Hourly Surveys: discharge checks completed in each hour today.
Hourly Responses by “Yes” vs “No”: Yes answers (green) and No answers (red) per hour.
Surveys: total discharge checks today.
Responses: total checklist answers today.
Yes Count and No Count: how many answers were Yes (or SAT) and how many were No (or UNSAT). NA answers are not in either.
Yes Ratio: Yes divided by Yes plus No. The small mark on the gauge is the 90% target.
Who can do this
Everyone: IC accounts, M1 accounts and Directors (M2). The numbers cover your whole company for today.
Tips
Hover a point on a chart for the exact hour and count.
Who checked which rooms, and NA counts, are on DR Dashboard (M). History is on DR Daily. Both are for M1 accounts and Directors (M2).