PV and DR Reports is the new web report for Patient Visit (PV) surveys and Discharge Room (DR) checks. It opens fast, works on a phone, and shows you which questions and which rooms need attention first. The earlier Power BI pages are still there under Classic report.
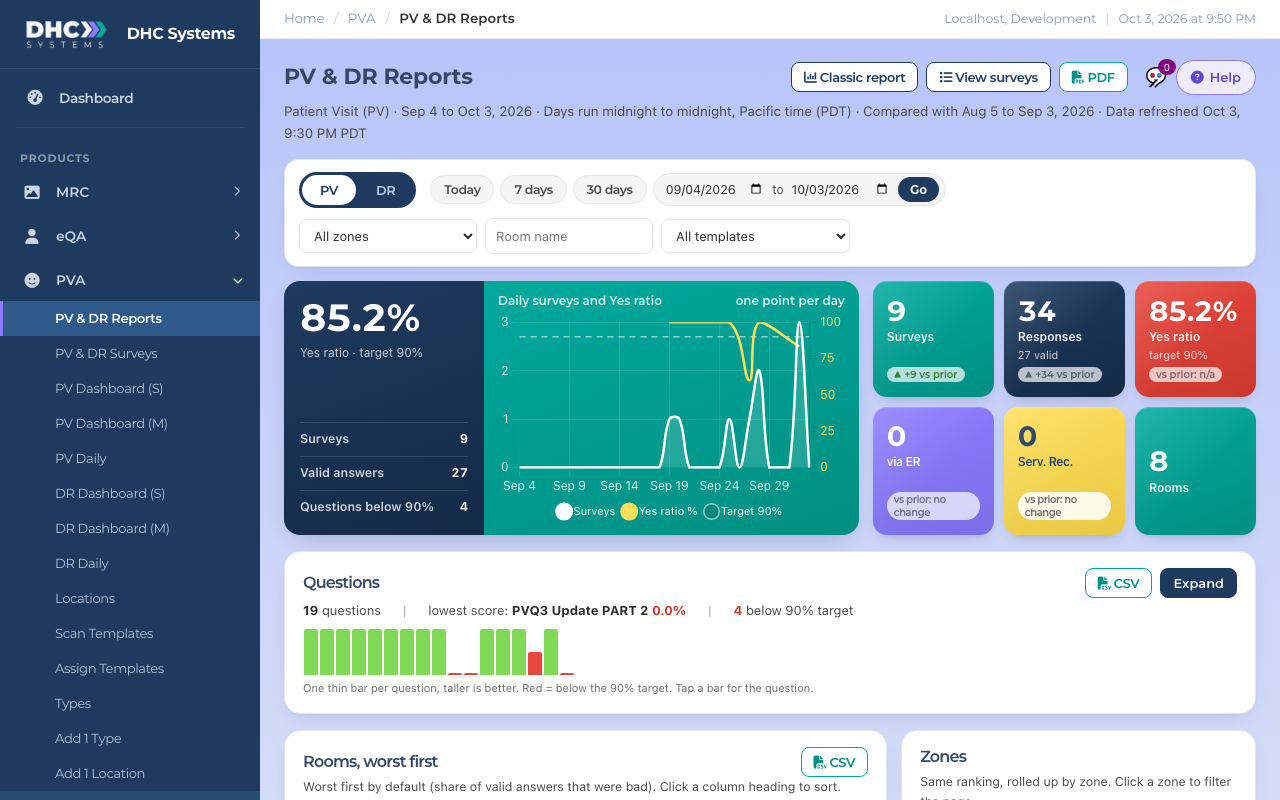
Watch: a tour of PV & DR Reports (1:42)The report on a desktop screen
How to open it
In the sidebar click PVA, then PV & DR Reports.
Pick PV or DR at the top left.
Pick a period: Today, 7 days, 30 days, or choose two dates and click Go.
Narrow it with All zones (only zones that have surveys in your period), Room name or All templates if you want. Free Form (no template) means rooms that use their own questions. Click Clear filters to start over.
Filter to one room and a line under the filters tells you which template its surveys used.
Pick the kind, the period and the filters
What is on the page
Tiles: Surveys, Responses, Yes ratio (green at 90% or more, red below), and on PV the via ER and Serv. Rec. counts.
Each tile can show a small vs prior line: the change compared with the period of the same length that ended the day before yours started (7 days against the 7 days before). Ratios move in points, counts move by number. Green is a change in the good direction, red is the other way (more bad answers or more service recoveries are red). A small arrow inside a question’s score means that score moved by a point or more; hover it to see the earlier score.
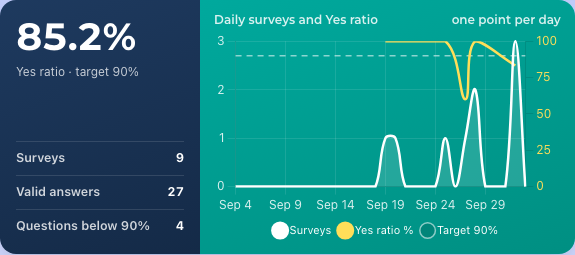
Daily trend: surveys and Yes ratio, one point per day, with the 90% target as a dashed line.
The daily trend
Questions: this card starts collapsed. The summary line tells you how many questions there are, which one scored lowest, and how many are below the 90% target. The thin bars are one per question: taller is better, red is below target. Click Expand to see every question. It stays open while you change filters, and starts collapsed again on your next visit.
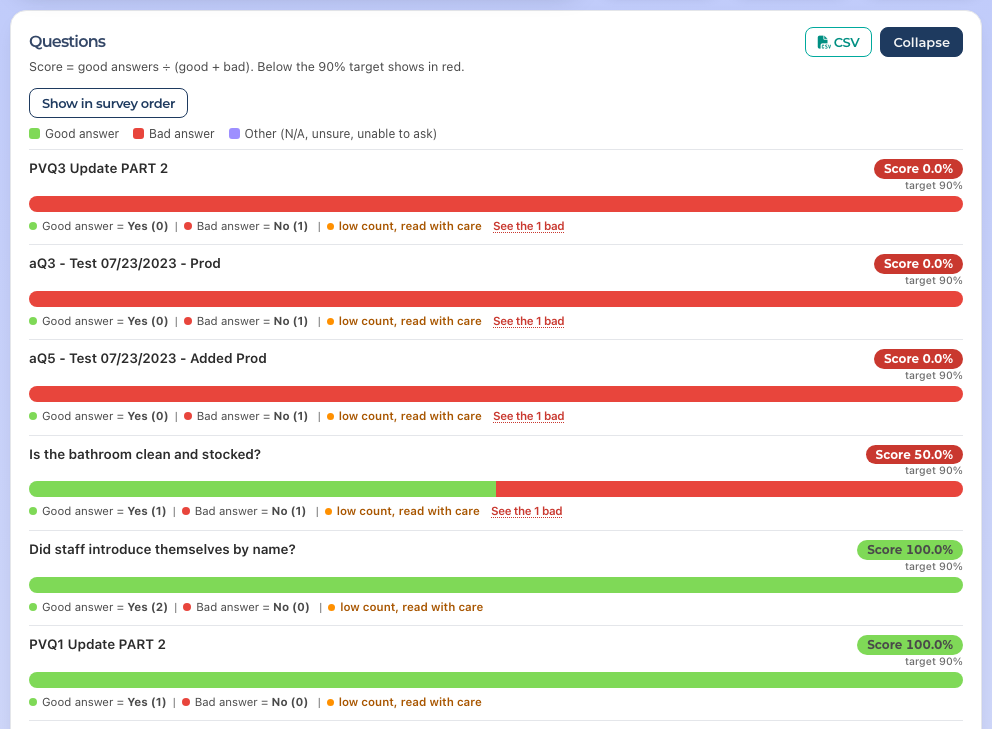
Each question has one bar. Green is the good answer, red is the bad answer, purple is Other answers such as N/A, patient unsure or unable to ask. On the right you see Score, for example Score 89.6%, with the 90% target underneath. Score = good answers divided by (good + bad). A score below the target shows in orange. Red does not mean 89.6% were bad: it means 89.6% were good, which is under the target.
Under each bar you see the counts, for example Good answer = Yes (822) | Bad answer = No (5) | Other = Patient Unsure (3). Hover over a bar, or tap it on a phone, to see the label, count and percent.
Questions are listed in survey order. Click Show worst first to sort them by score, lowest first, and Show in survey order to switch back.
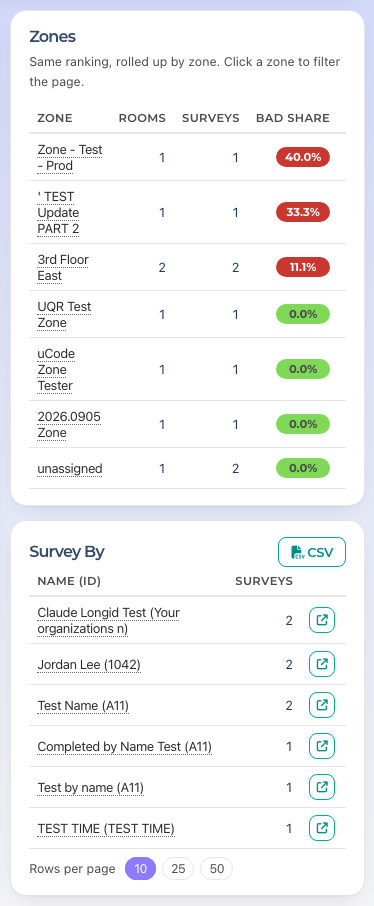
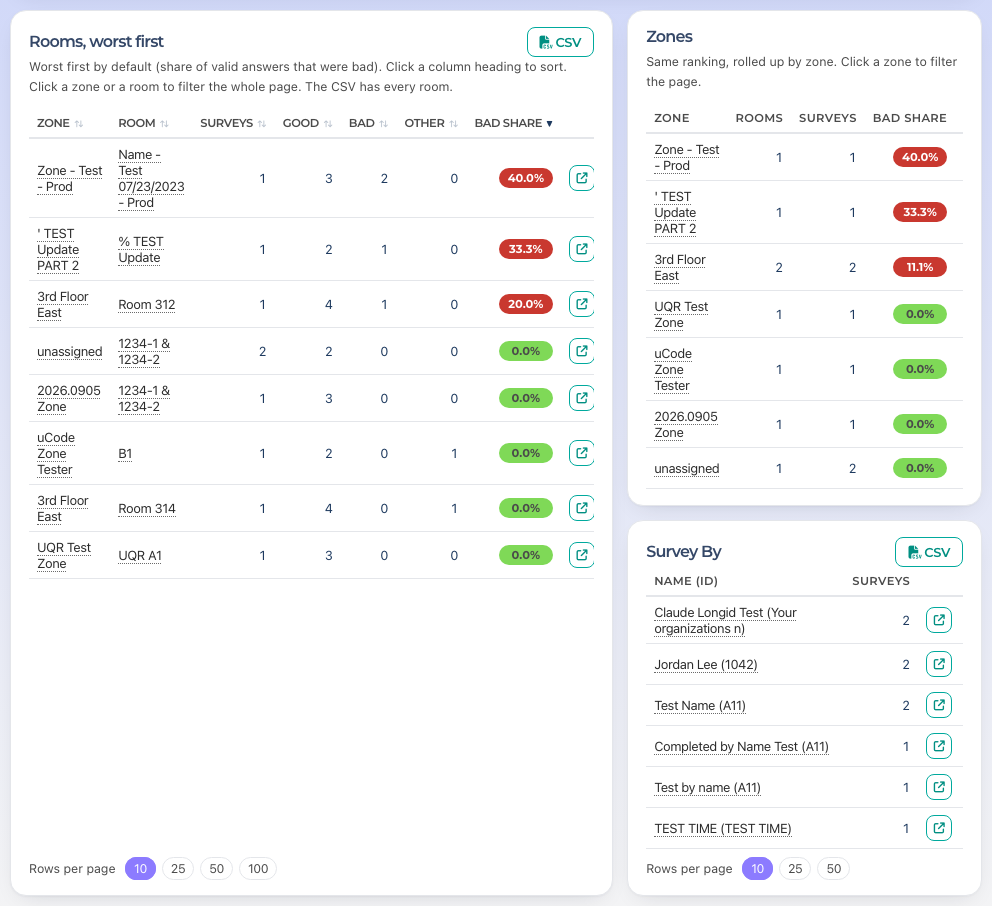
Survey By: a card in the right-hand column under Zones. It lists the people who did surveys in your period, most surveys first, as Name (ID) (just the name when no ID was entered) with their number of surveys, ten per page. Use Rows per page for 25 or 50 and the page numbers underneath to move through. Click a name or the small arrow button at the end of the row to open the surveys list for that person. The CSV button downloads everyone with their Yes ratio and bad answers, and the PDF has the top 25 with the same columns. The card covers up to the last 92 days of your period; hover the small i beside the title for that note.
The Rooms, Zones and Survey By cards share one row. Rooms is on the left; Zones and Survey By stack on the right, and the bottom edges line up. Nothing scrolls inside a card: long lists use page numbers (Zones shows 10 per page). On a phone the cards stack: Rooms, then Zones, then Survey By.
Every row in Rooms, Zones and Survey By ends with the same small arrow button, View surveys. It opens the surveys list for that room, zone or person for your period. Clicking a room or zone name filters this page instead; a Survey By name opens the surveys list, like its arrow.
Zones and Survey By beside the Rooms table
Multi-option and information questions: questions with more than three answer options, such as the cleanliness rating, show as one split bar with a legend. Click an option in the legend to hide or show it. These are not part of the Yes ratio. This card has its own CSV button.
Questions as good and bad bars
Rooms, worst first and Zones: the share of valid answers that were bad, so you can see where to look first. The rooms table shows Zone, Room, Surveys, Good, Bad, Other and Bad share, 10 rooms at a time. Click a column heading to sort by it, and click again to flip the order; the arrow shows which column is sorted. Use Rows per page for 25, 50 or 100. Click a zone or a room name to filter the whole page to it.
Rooms and zones ranked by bad share
Good answers
Every question has one good answer. For most it is Yes. For a few, such as Is this a Service Recovery?, the good answer is No. The page already accounts for that, so higher is always better.
Jump from a number to the surveys behind it
Most counts are links. Click View surveys at the top, the via ER or Serv. Rec. tile, the See the N bad link under a question, or the small surveys link beside a room. You land on the surveys list with the same period and filters already set. See the article PV and DR Surveys.
Download the numbers
Click CSV on the Questions card, the Multi-option card or the Rooms card.
Open the file in Excel. It contains exactly what you see, with every room.
Print or save a PDF
Set the period and filters you want.
Click PDF next to Help at the top of the page. The report opens in a new tab as a landscape PDF.
Use your browser to save or print it. The PDF is a portrait Letter page set with the tiles, the daily trend, every question, the multi-option questions, a Rooms needing attention table and the zones, with the date it was generated and page numbers at the bottom. The rooms table always lists the worst 50 rooms that had at least one bad answer, worst first, no matter how you sorted the page. A line under it says how many rooms had a bad answer and how many had none; the CSV has every room.
Click PDF to open the report as a PDF in a new tab
Help
The Help button above the report opens a short guide to the page without leaving it: how to read the charts, how the filters work, and what to do if the data looks out of date. For anything else, ask Sage from the sidebar.
Who can do this
IC accounts, M1 accounts and Directors (M2). The page is read only. People (the Survey By card and who did each survey) and comments are shown to M1 and Director (M2) accounts; IC accounts see the numbers without them.
Tips
“Today” means today at your facility, from midnight to midnight in your own time. The line at the top names your time zone and shows when the data last refreshed.
If the same survey was sent twice, it is counted once. The number removed shows under Surveys.
When a question or room has fewer than 10 valid answers you see an orange note, low count, read with care, because one answer can swing the percentage. The colour still follows the 90% target.
Click Help on the page for the short version of all of this.