Dashboard (S) is the quick look at today. Open it when you want to know, in five seconds, whether rounds are happening and how they are going. It is the first MRC page every account type sees, including workers.
The snapshot for today
How to open it
Click MRC in the sidebar, then Dashboard (S).
Give the report a few seconds to load. It is a live Power BI report, so it pulls fresh numbers every time.
Leave the toggle at the top on Power BI. The Web Chart option is a placeholder for a future chart view and shows “coming soon”.
Keep this on Power BI
What each part means
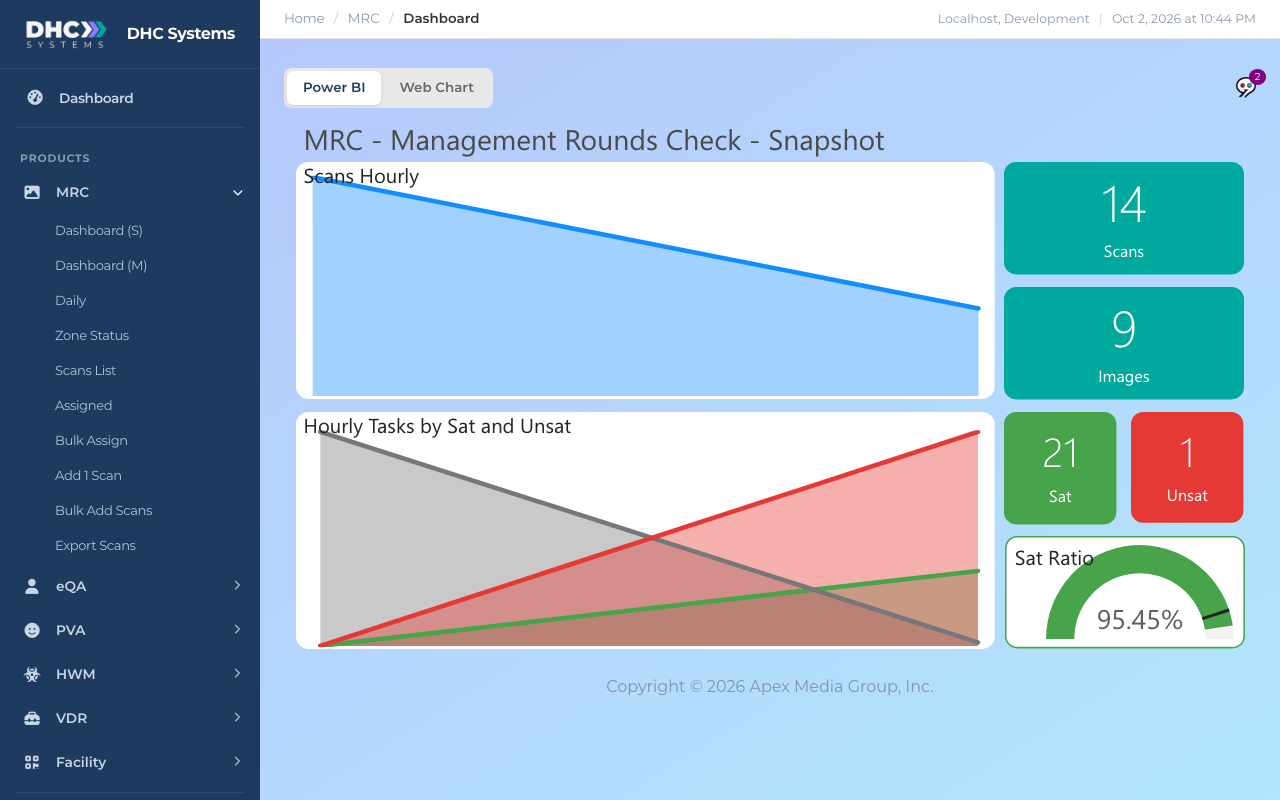
Scans Hourly (top chart): how many checks were logged in each hour today. A flat line at zero means nobody has scanned yet. Hover a point to see the exact count for that hour.
Hourly Tasks by Sat and Unsat (bottom chart): the task answers for each hour, green for Sat, red for UnSat and grey for NA. Hover to read the numbers.
Scans tile: total checks logged today.
Images tile: how many of today’s checks included a photo or video.
Sat and Unsat tiles: today’s satisfactory and unsatisfactory task answers.
Sat Ratio gauge: Sat divided by (Sat plus UnSat), with NA left out. The small marker on the gauge is the 90% target.
Who can do this
Everyone. IC accounts, M1 accounts and Directors (M2) all see Dashboard (S). The numbers are always for your company only.
Tips
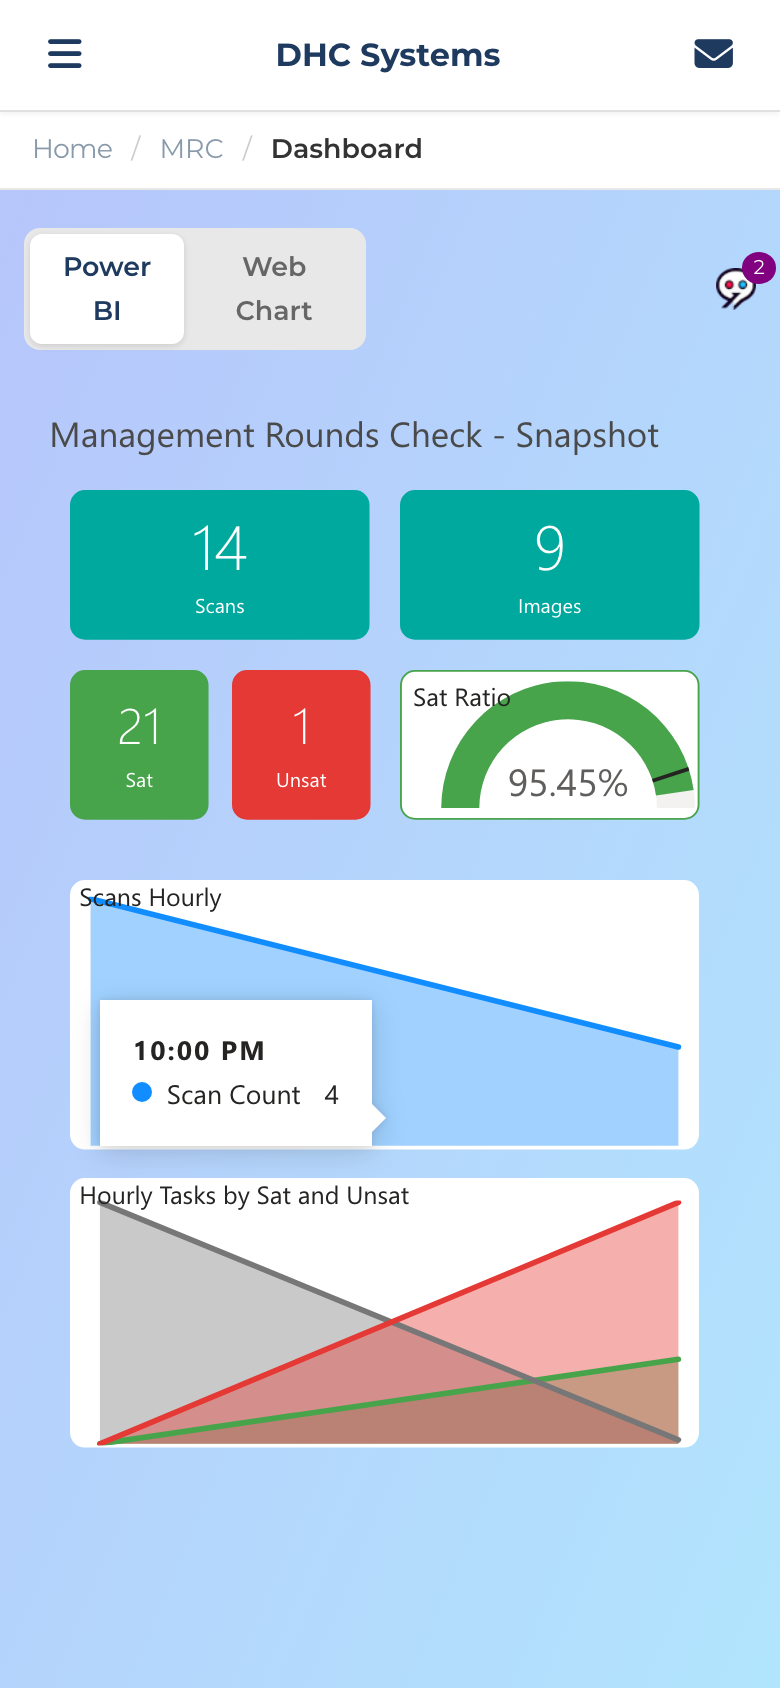
On a phone the same sidebar link opens a phone-sized version of this dashboard, laid out in one column. Tap a point on a chart to see its number.
The phone-sized snapshot
Want more than today? Use Daily for any date range, or Dashboard (M) for the per-person breakdown of today.
If the page says “The report is taking a moment to load”, wait a few seconds and refresh. Nothing is wrong with your data.