Daily is the report you open when the question is bigger than today. It covers any date range, and the same filters stay with you as you move between its six pages: daily, zone, area, user, fast scans and details.
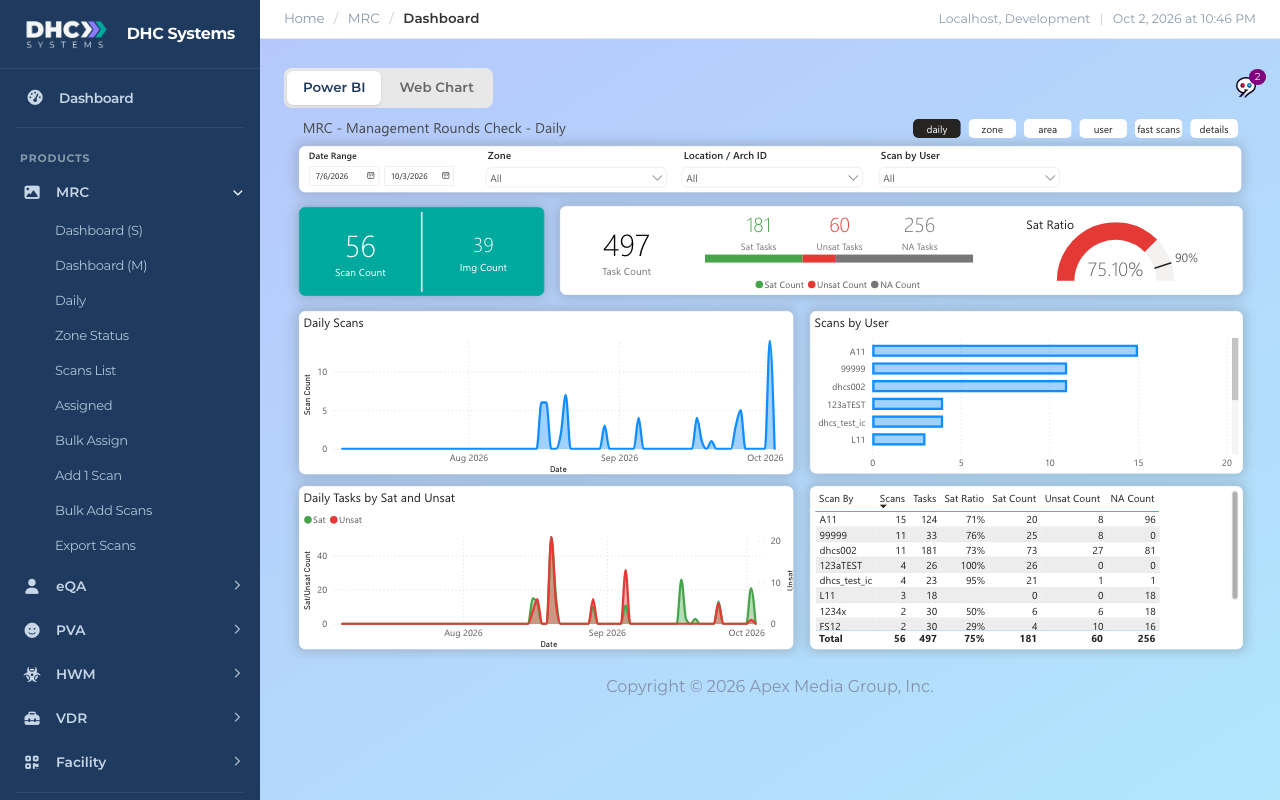
The daily page with the default 90-day range
How to use the filters
Click MRC, then Daily. The report opens on the daily page with the last 90 days selected.
Set the Date Range. Click either date to pick from a calendar, or type a date straight into the box. The page updates by itself.
Narrow further with Zone, Location / Arch ID or Scan by User. Each is a dropdown you can type into to find the entry you want.
Switch pages with the small pills in the top right (daily, zone, area, user, fast scans, details). Your filters carry over.
Click a bar in any chart to filter the rest of the page to it. Click the same bar again to clear.
The cards at the top of every page
Scan Count and Img Count: checks logged in the range, and how many had a photo or video.
Task Count with the Sat Tasks, Unsat Tasks and NA Tasks bar: every task answer in the range and how it splits. Green is Sat, red is Unsat, grey is NA.
Sat Ratio gauge: Sat divided by (Sat plus Unsat), NA left out, against the 90% target.
The daily page
Daily Scans: checks per day across the range. Gaps mean no rounds that day.
Daily Tasks by Sat and Unsat: the Sat (green) and Unsat (red) answers per day. A red spike is a day worth opening on the details page.
Scans by User: one bar per Employee ID.
The table on the right lists each person with Scans, Tasks, Sat Ratio, Sat Count, Unsat Count and NA Count.
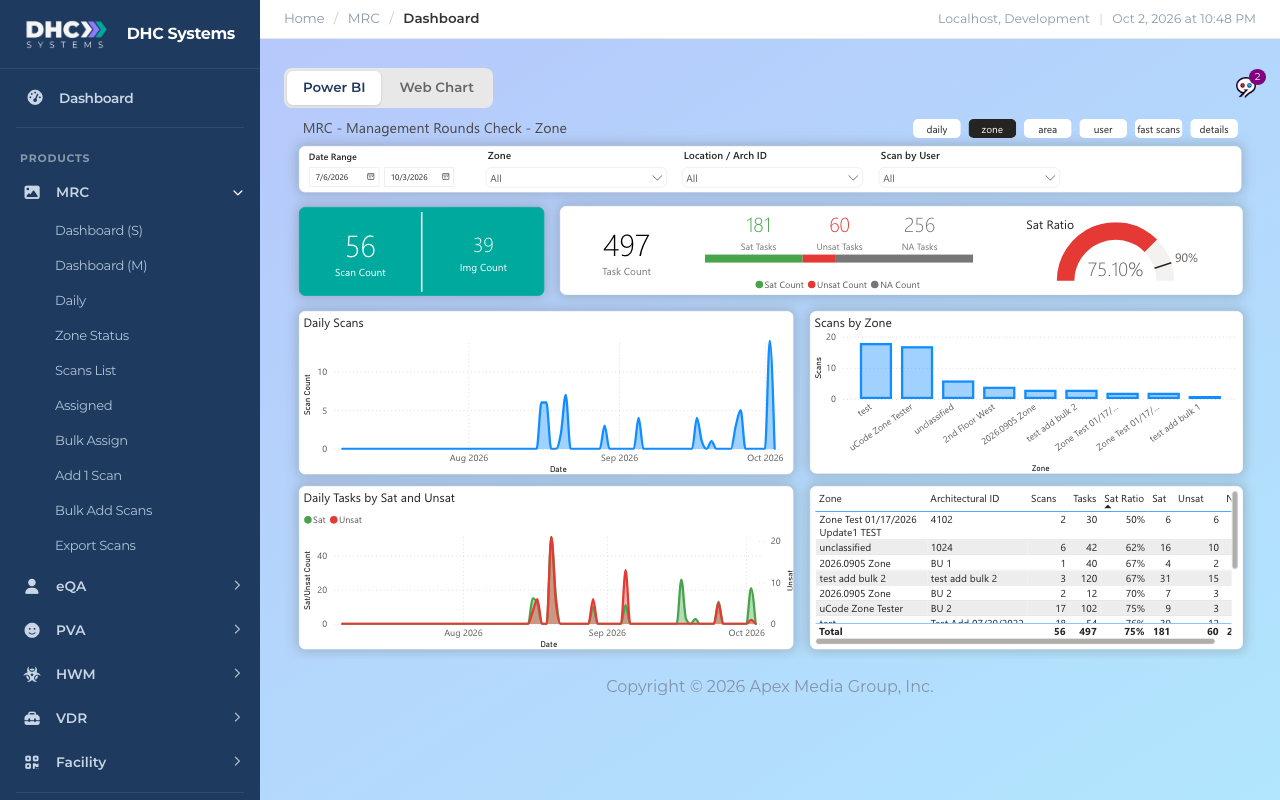
The zone page
Same cards and daily charts, plus Scans by Zone and a table of every zone and room with its scans, tasks and Sat Ratio. Use it to compare wings or floors.
Zone page
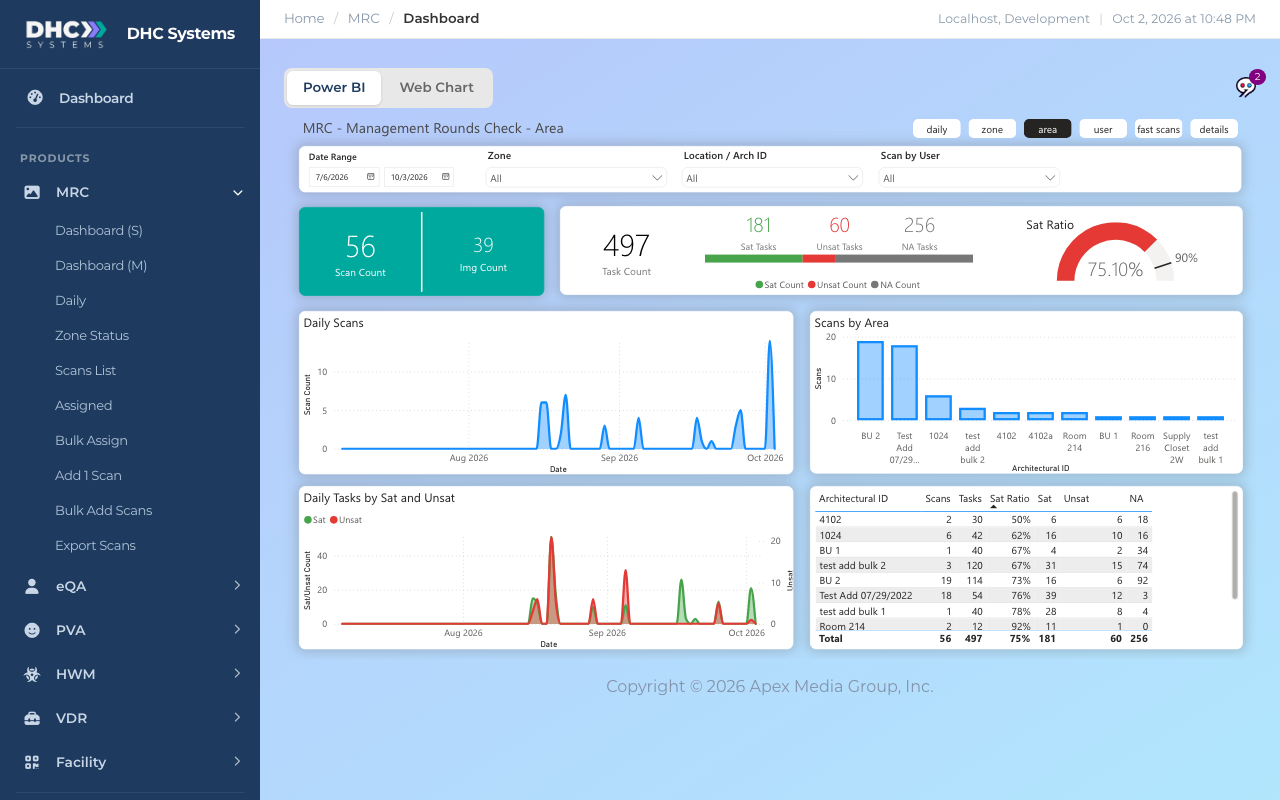
The area page
Swaps the zone chart for Scans by Area, one bar per Architectural ID, and a table of rooms with Scans, Tasks, Sat Ratio, Sat, Unsat and NA. This is the page for “which rooms keep failing”.
Area page
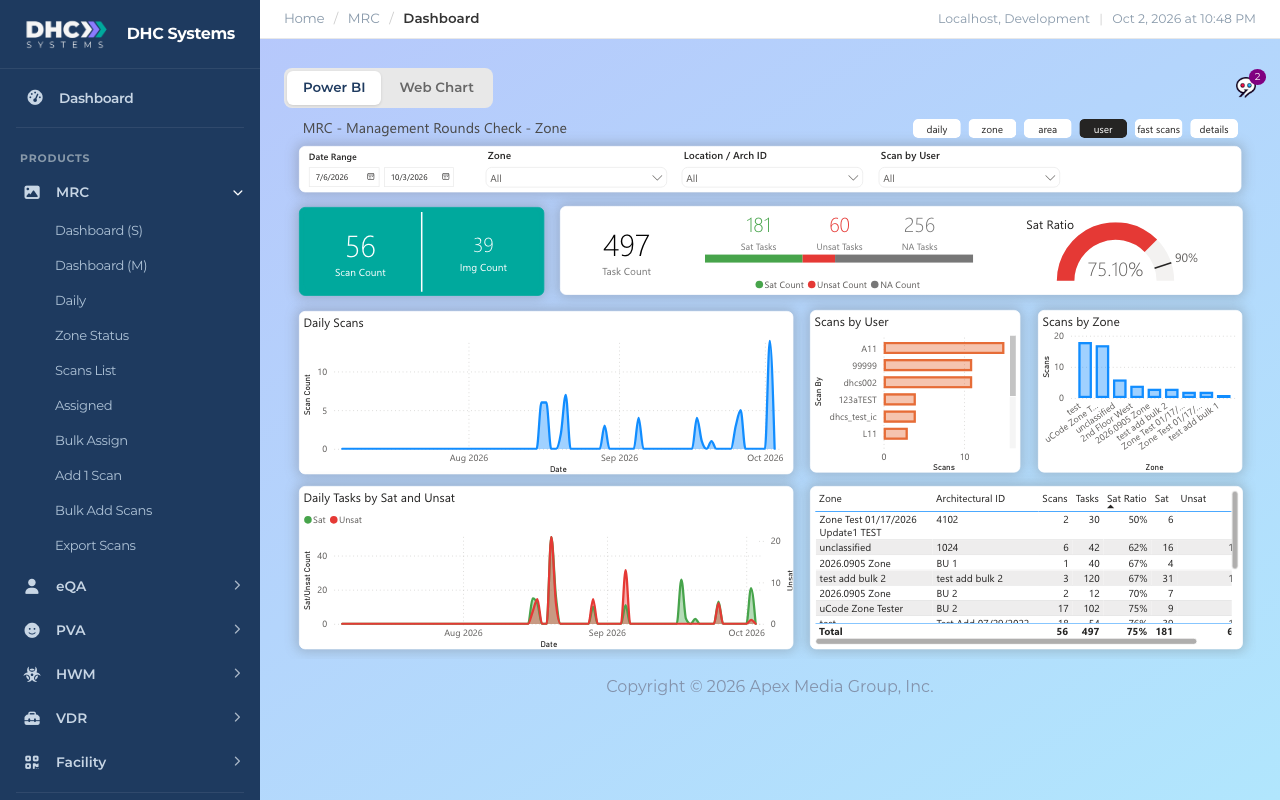
The user page
Puts Scans by User and Scans by Zone side by side so you can see who covers which part of the building, with the zone and room table underneath.
User page
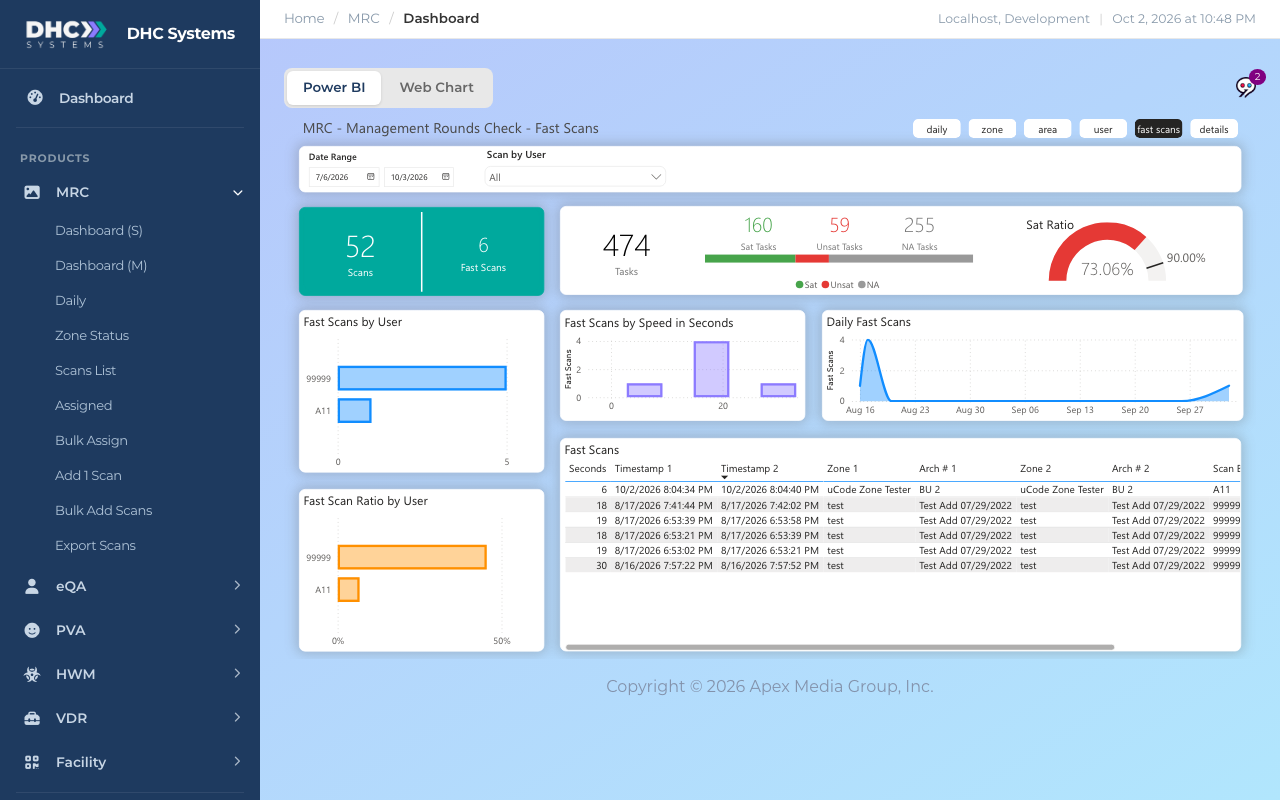
The fast scans page
Fast scans are two checks by the same person within about a minute. This page has its own filters (Date Range and Scan by User) and shows:
Scans and Fast Scans cards: how many checks in the range, and how many were flagged.
Fast Scans by User and Fast Scan Ratio by User: who gets flagged, as a count and as a share of their scans.
Fast Scans by Speed in Seconds: how close together the flagged pairs were.
Daily Fast Scans: when they happened.
The Fast Scans table: every flagged pair with Seconds, Timestamp 1, Timestamp 2, Zone 1, Arch # 1, Zone 2, Arch # 2 and Scan By.
Fast scans page
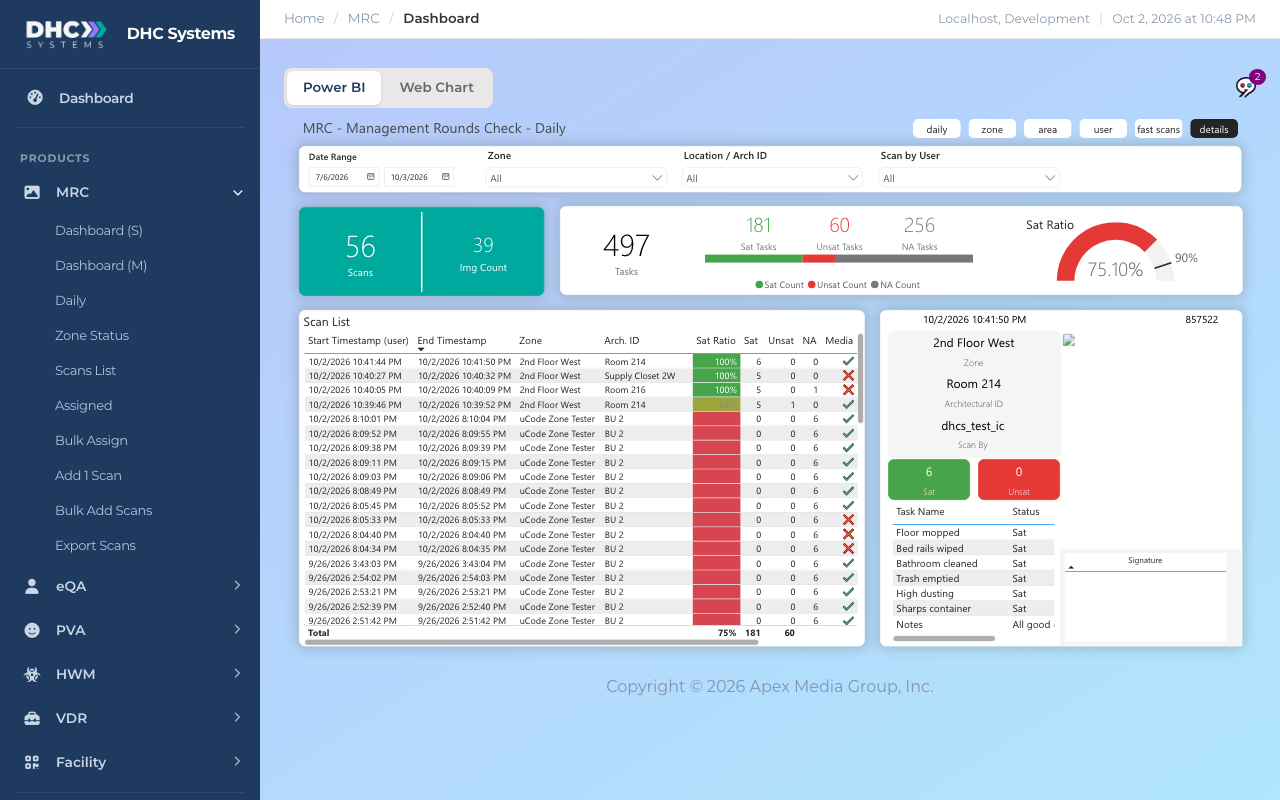
The details page
Every individual check in the range, in the Scan List: Start Timestamp, End Timestamp, Zone, Arch. ID, Sat Ratio (green for 100%, redder as it drops), Sat, Unsat, NA and Media (a tick when a photo or video was attached). Click a row and the card on the right shows that check: zone, room, who scanned, the Sat and Unsat tiles, every task with its answer, the notes, the photo and the signature.
Details page with Room 214 selected
Print Page and Help
Two buttons sit above the report. Print Page prints the report page you are looking at, in landscape, with the sidebar and menus left out. In the Chrome print dialog open More settings and tick Background graphics so the colored tiles print. Help opens a short guide to the page without leaving it: how to read the charts, how the filters work, and what to do if the data looks out of date. For anything else, ask Sage from the sidebar.
Print Page and Help sit above every product report.
Who can do this
M1 accounts and Directors (M2). Workers do not see Daily in the sidebar.
Tips
Hover any point or bar for the exact number behind it.
Hover a visual and small icons appear in its top-right corner. Focus mode opens that one chart or table full size.
Type in the Location / Arch ID box rather than scrolling. Room lists get long.
If the report is slow for a long range, pick a zone first. It cuts the work the report has to do.