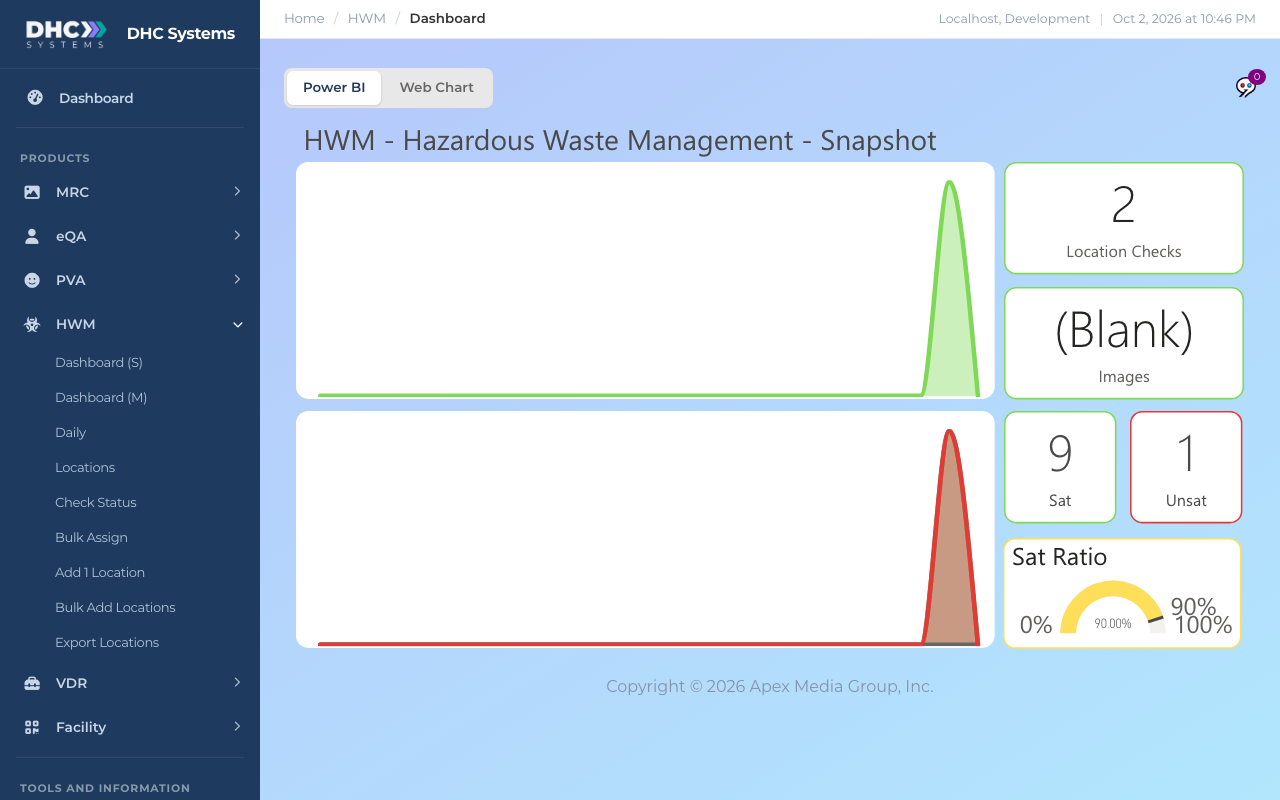
Dashboard (S) is the quick look at today. Five tiles and two charts, no settings to pick. Open it from HWM, then Dashboard (S). It is the one HWM report workers can see too.
Dashboard (S) after two checks today
How to read it
Wait a moment for the report to load. The page says “Power BI” in the toolbar at the top; leave it there.
Read the tiles on the right first. They are today’s totals.
Glance at the two charts on the left. A spike shows when the checks happened.
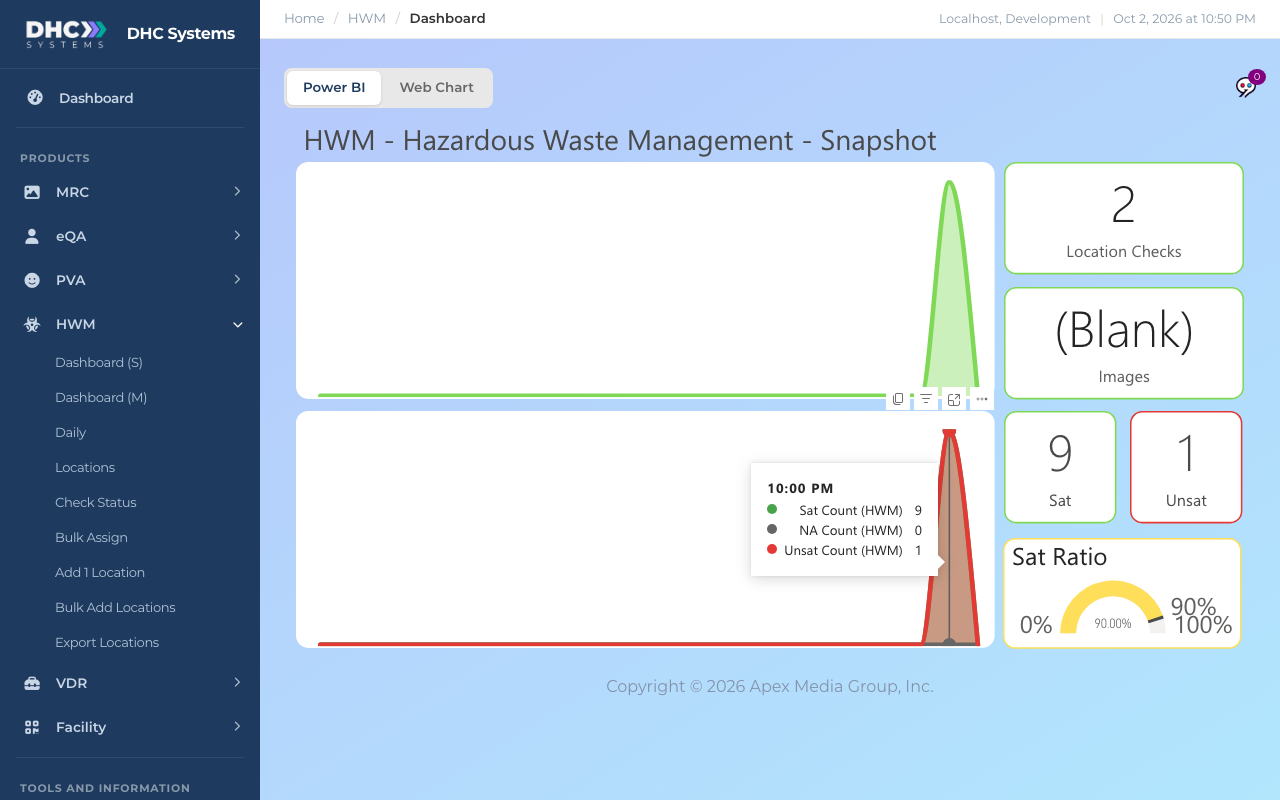
Hover over any spike to see the numbers behind it.
Hover a spike to see the counts for that hour
What the tiles mean
Location Checks: how many scans were submitted today.
Images: how many of today’s checks had a photo or video attached. It shows “(Blank)” when nobody has attached one yet.
Sat: tasks answered Sat today, across all checks.
Unsat: tasks answered UnSat today. Anything above zero deserves a look on Dashboard (M) or the Daily report’s details tab.
Sat Ratio: Sat divided by all answered tasks, as a gauge from 0% to 100%. The small tick near the right is the 90% mark.
What the charts mean
Top chart (green): location checks by hour of the day. One bump per burst of scanning.
Bottom chart (red): tasks by hour, split into Sat, NA and UnSat. The hover tooltip lists all three.
On a phone
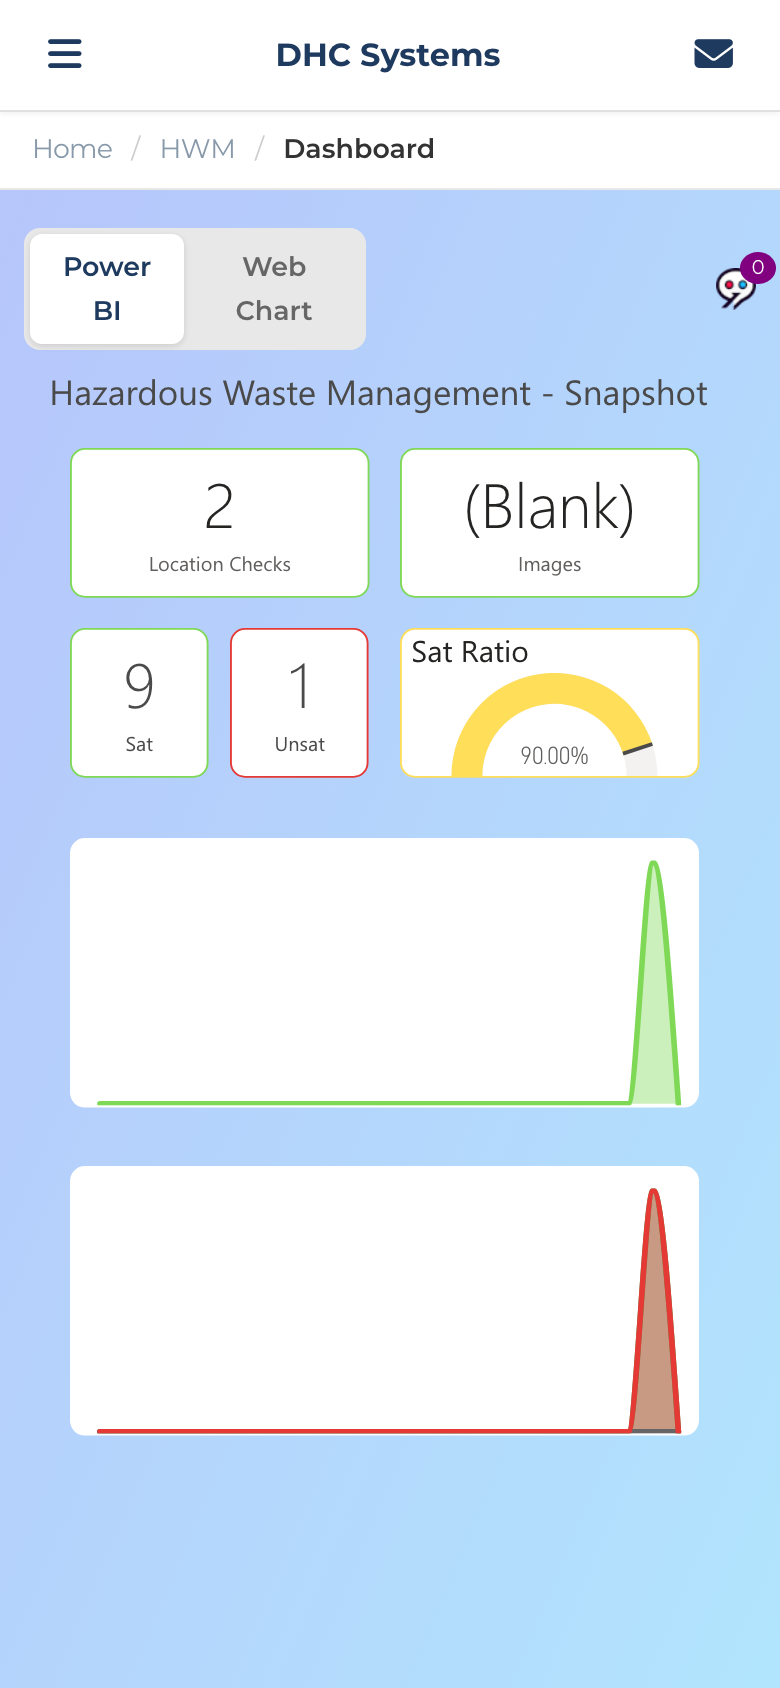
On a phone the same report rearranges itself: tiles first, then the two charts stacked underneath. Nothing is left out.
Dashboard (S) on a phone
Who can do this
Everyone. Workers (IC accounts), M1 accounts and Directors (M2) all see Dashboard (S). The numbers are always for your whole organization, not just your own scans.
Tips
The snapshot resets at midnight, your local time. For yesterday or last month, use Daily.
If the report area stays blank for more than a minute, refresh the page. The first load of the day can be slow.
The “Web Chart” button in the toolbar is a placeholder for a future version; it does not show data yet.