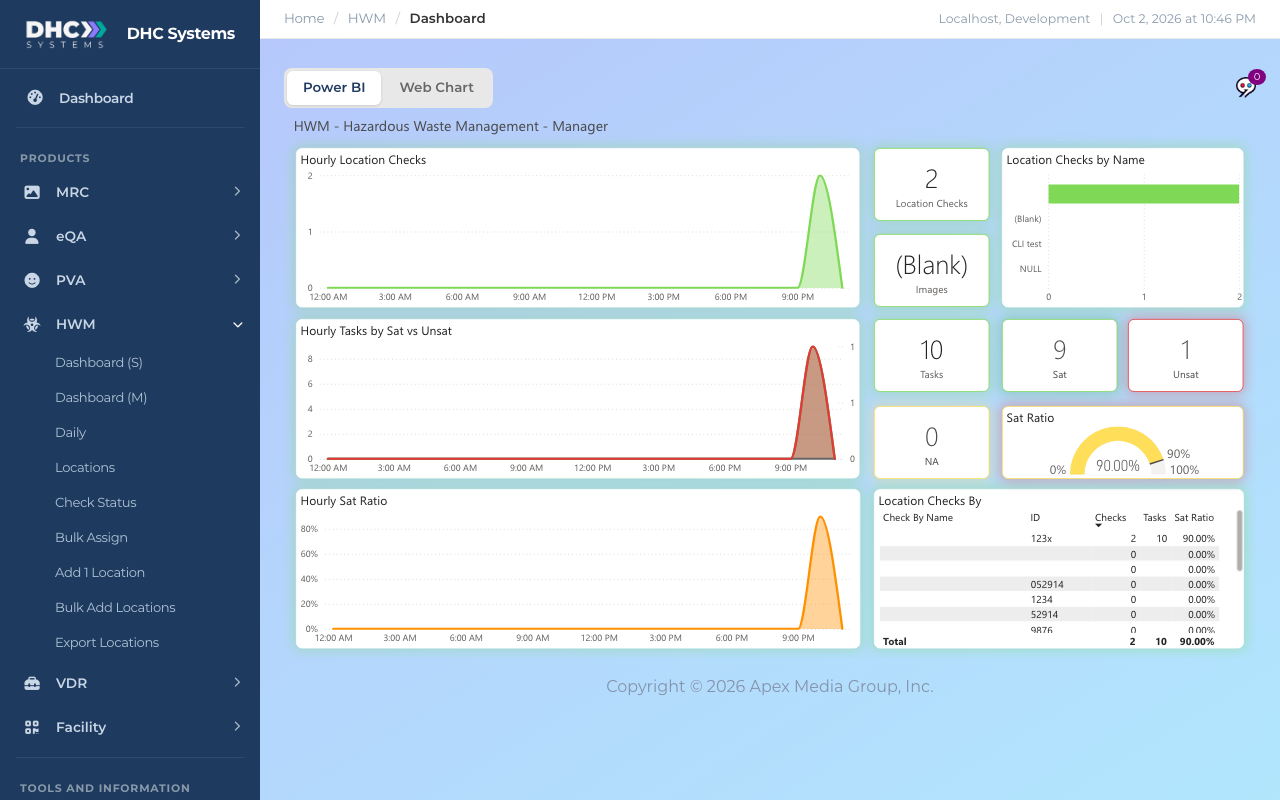
Dashboard (M) is today in more detail. It keeps the tiles from Dashboard (S) and adds the hourly Sat Ratio, checks by location and a table of who did what. Open it from HWM, then Dashboard (M).
Dashboard (M) on a desktop
How to use it
Open Dashboard (M) and wait for the visuals to fill in.
Check the Unsat tile. If it is above zero, look at the Location Checks By table to see whose checks had the misses.
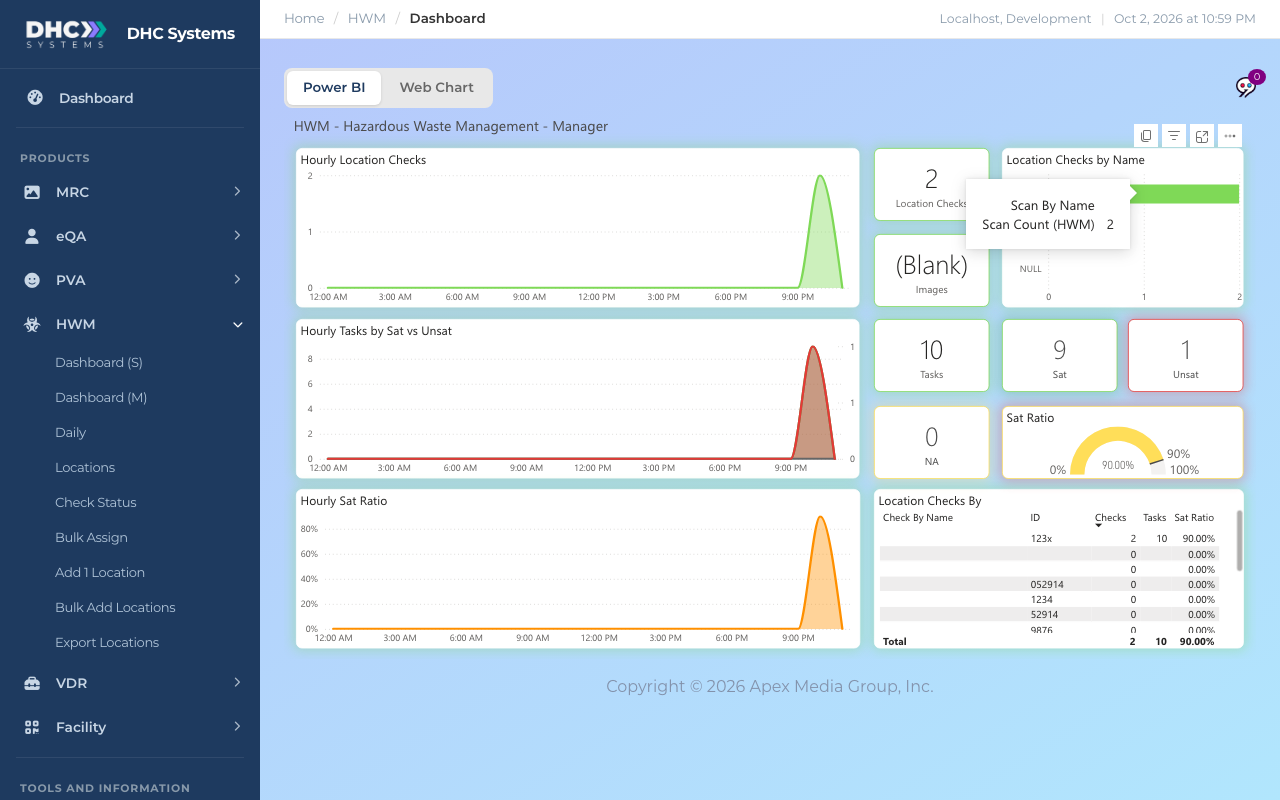
Click a bar in Location Checks by Name to filter the whole page to that person. Click it again to clear.
Hover any chart point for the exact numbers for that hour.
What the visuals mean
Hourly Location Checks: how many scans were submitted in each hour today.
Hourly Tasks by Sat vs Unsat: task answers per hour. Green is Sat, red is UnSat, grey is NA.
Hourly Sat Ratio: the Sat percentage for each hour, so you can see whether quality dipped at a particular time.
Location Checks, Images, Tasks, Sat, Unsat, NA: today’s totals. Sat plus Unsat plus NA equals Tasks.
Sat Ratio: the gauge from 0% to 100%, with the 90% mark shown.
Location Checks by Name: a bar per person who scanned today. People are matched by the Employee ID entered on the phone; the table below shows the IDs.
Location Checks By: one row per person with their ID, Checks, Tasks and Sat Ratio. The Total row is the whole organization.
Hover a bar for the count; click it to filter the page
On a phone
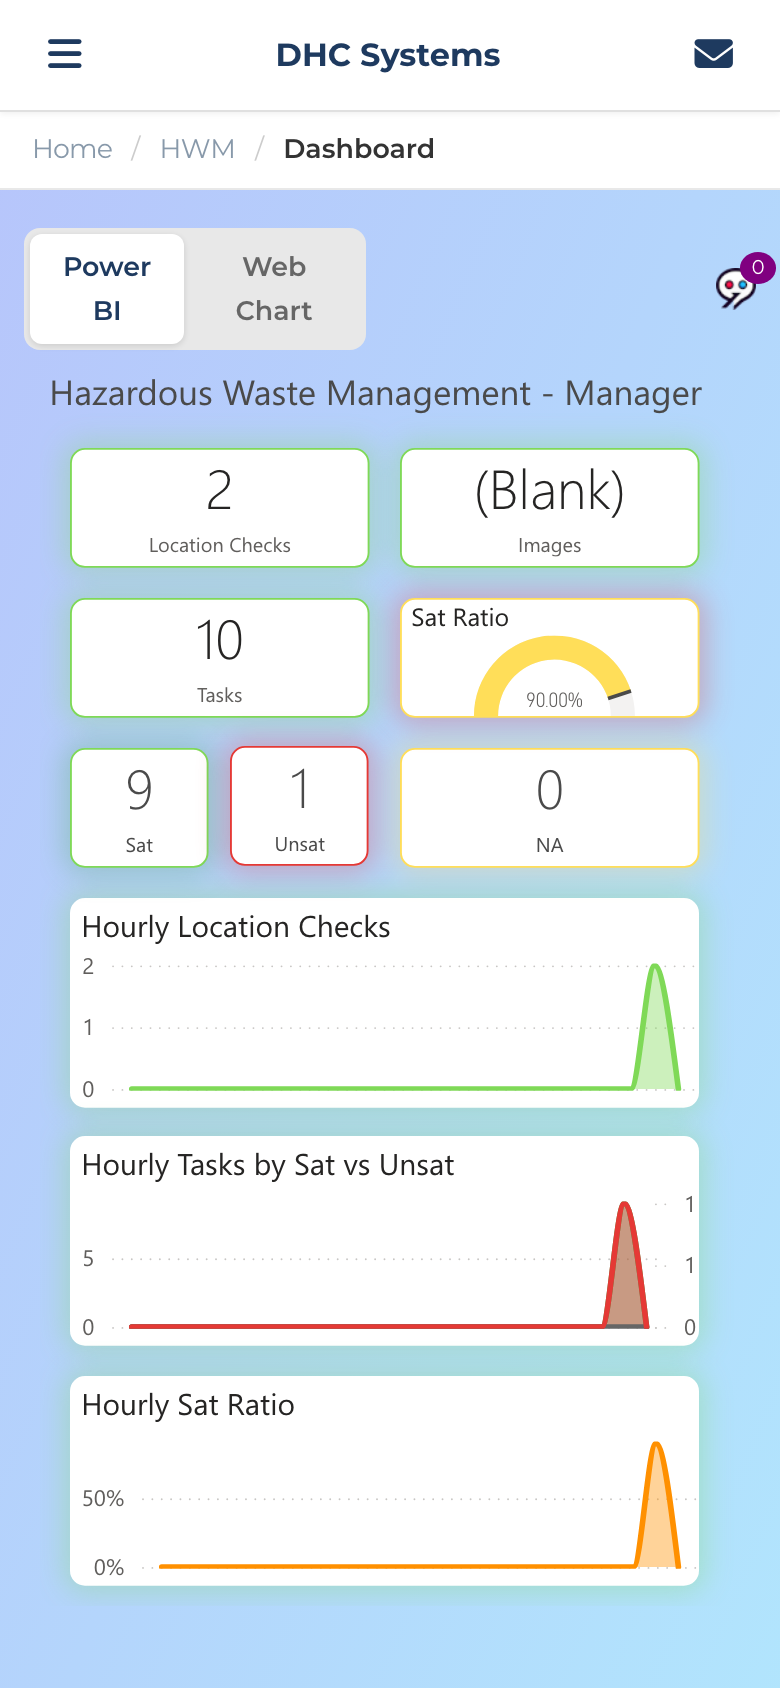
On a phone the tiles come first, then the three hourly charts, one under another.
Dashboard (M) on a phone
Who can do this
M1 accounts and Directors (M2). Workers do not see Dashboard (M) in their menu.
Tips
If a row shows an ID you do not recognize, the worker typed it by hand. Assigning the location (see “HWM Bulk Assign”) fills the right ID in for them next time.
Dashboard (M) is today only. For a date range, switch to Daily.