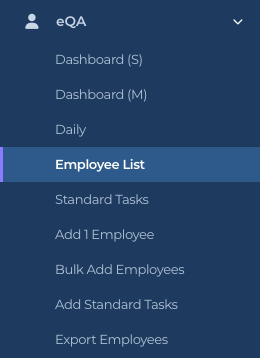
Dashboard (S) is the one-glance view of today’s eQA activity: how many QAs have happened, how the checks came out, and the Sat Ratio. It is the only eQA report a worker (IC account) sees, and it is the first thing to look at in the morning. Open it from eQA, then Dashboard (S).
Dashboard (S) is the first link in the eQA group
How to open and read it
Click eQA in the sidebar, then Dashboard (S).
Give the report a few seconds. It is a Power BI report, so it loads after the rest of the page. If you see “The report is taking a moment to load”, refresh the page.
Leave the toggle on Power BI. The Web Chart option is a placeholder for a future lighter chart and is empty for now.
Keep Power BI selected
Hover over any point on a chart to see the numbers behind it. Hover over a chart’s top right corner and click the Focus mode icon to open it full size; press Back to report to return.
The report title confirms you are on the Snapshot page
What the visuals mean
The page is called eQA – electronic Quality Assurance – Snapshot inside the report. Everything on it is for today only.
QA’s Hourly (large chart, top left). How many QAs were submitted in each hour of today. A peak at 9 AM means most checking happened then.
Hourly Checks by Sat vs Unsat (large chart, bottom left). The individual checks inside those QAs, by hour. Green is Sat, red is Unsat, blue is NA. Red peaks are where to look first.
QA’s (teal tile). The number of QAs completed today.
Images (teal tile). How many photos or videos were attached to today’s QAs. It shows “(Blank)” when there are none yet.
Sat (green tile) and Unsat (red tile). Counts of Sat and UnSat checks today. Added together they are all the answered checks, not counting NA.
Sat Ratio (gauge). Sat divided by Sat plus UnSat, as a percentage. The needle sits near the right when almost everything is satisfactory.
Who can do this
Everyone with an eQA login: IC accounts, M1 accounts and Directors (M2). The numbers are always for your own company only.
Tips
There are no filters on this page on purpose. For a date range, employee or manager filters, use Daily.
On a phone the dashboard switches to a stacked layout automatically. Nothing to set.
If the tiles all read zero or blank, nobody has scanned yet today. The Employee List’s Last QA column is the quickest way to confirm.