
DHC Systems Guide

DHC Systems Guide

Did You Know?

Daily is where you look back. Pick a date range, then move across the five tabs at the top: daily, zone, location, user and details. Open it from HWM, then Daily.
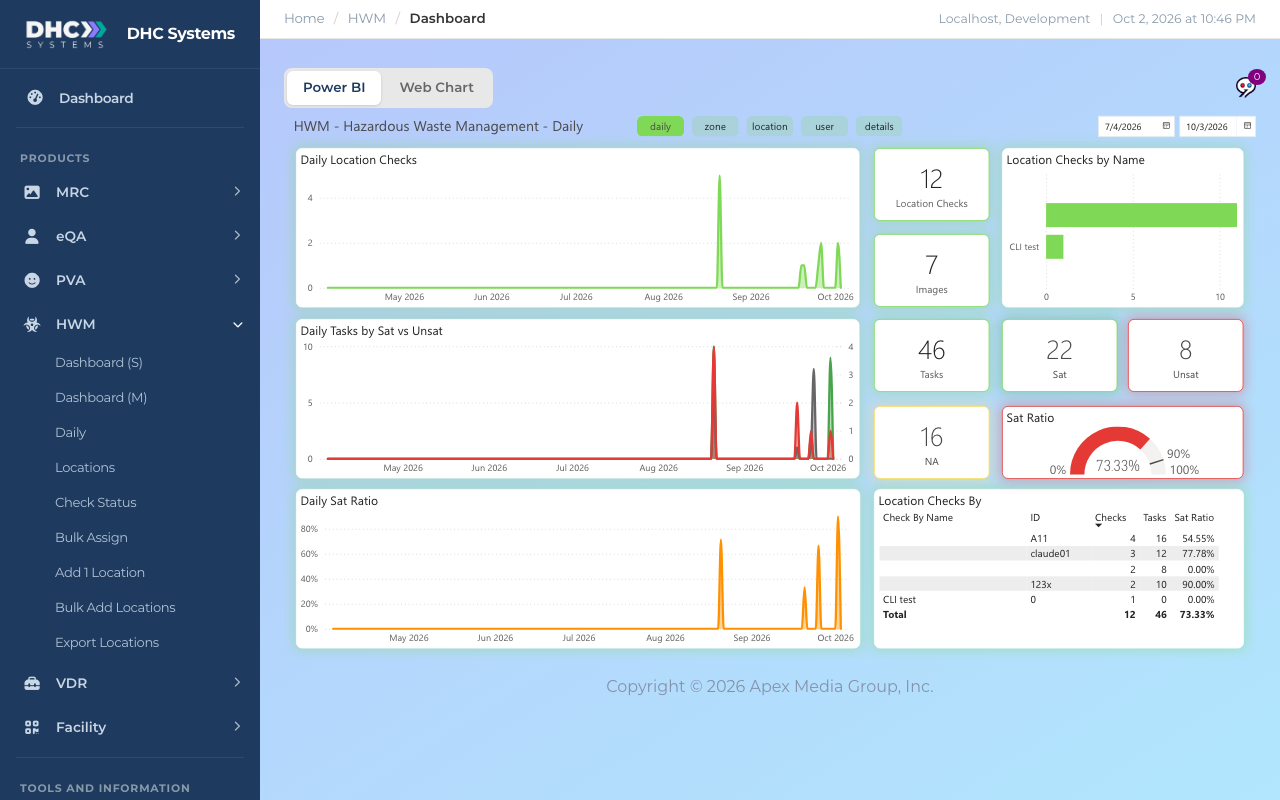
HWM Daily report with the daily tab selected, date pickers top right, Daily Location Checks, Daily Tasks by Sat vs Unsat, Daily Sat Ratio, totals tiles, Location Checks by Name and the Location Checks By table
The Daily report on its first tab

How to run it

  1. Open Daily and wait for the visuals to load.
  2. Set the two dates in the top right corner. Click a date to pick from a calendar, or type over it. The page updates by itself.
  3. Click a tab name next to the title to change what the right-hand column shows. The green tab is the one you are on.
  4. Hover a chart point for the numbers behind it. Click a bar or a table row to filter the rest of the page to it; click again to clear.

The left side, same on every tab

  • Daily Location Checks: scans per day across the date range.
  • Daily Tasks by Sat vs Unsat: task answers per day. Green Sat, red UnSat, grey NA.
  • Daily Sat Ratio: the Sat percentage for each day.
  • The tiles: Location Checks, Images, Tasks, Sat, Unsat, NA and the Sat Ratio gauge, all for the range you picked.

The tabs

daily

Checks by person: a Location Checks by Name bar chart and the Location Checks By table with ID, Checks, Tasks and Sat Ratio per person.

zone

Swaps the bar chart for Location Checks by Zone, so you can see which areas are being checked and which are quiet.
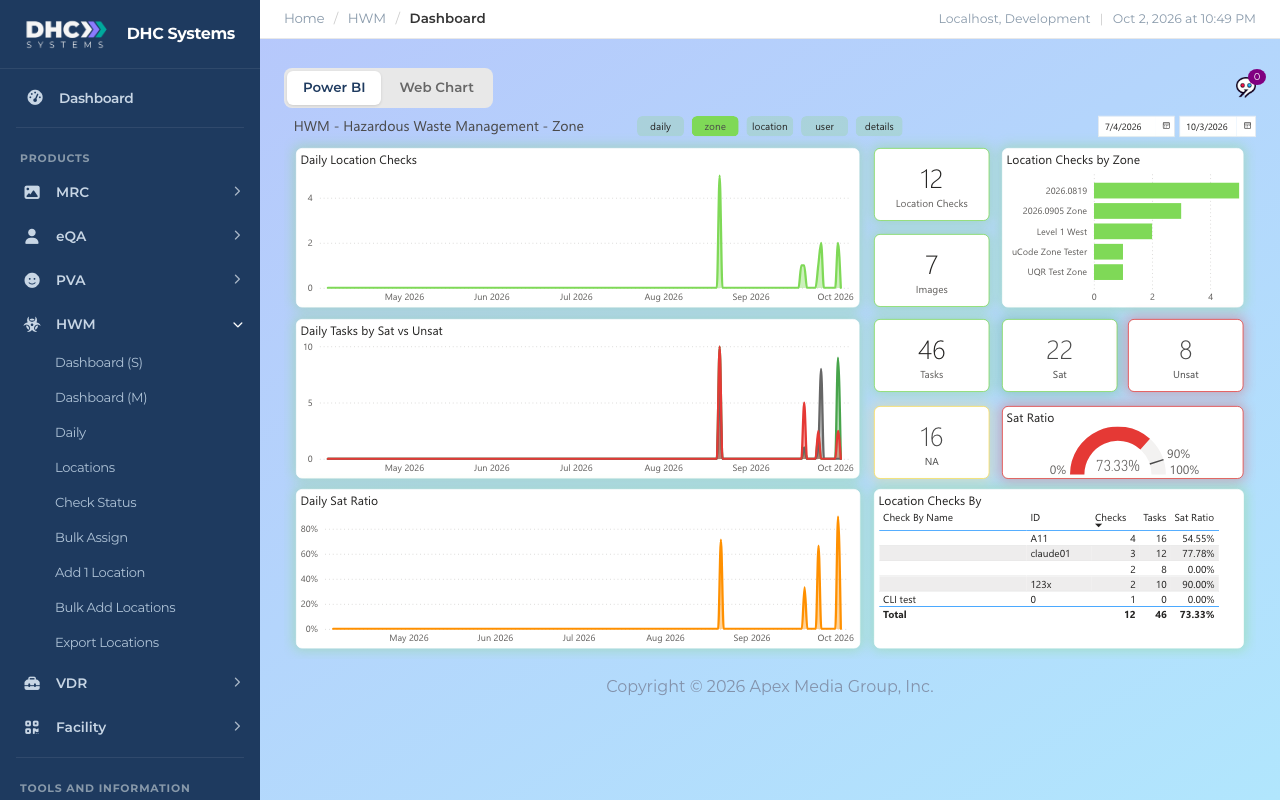
The Daily report on the zone tab with a Location Checks by Zone bar chart listing zones including Level 1 West
The zone tab

location

Locations Checked as a bar chart and a Location Checks By table with one row per location: Checks, Tasks, Sat Ratio, Sat, Unsat and NA. This is the fastest way to spot a room with repeated UnSat answers.
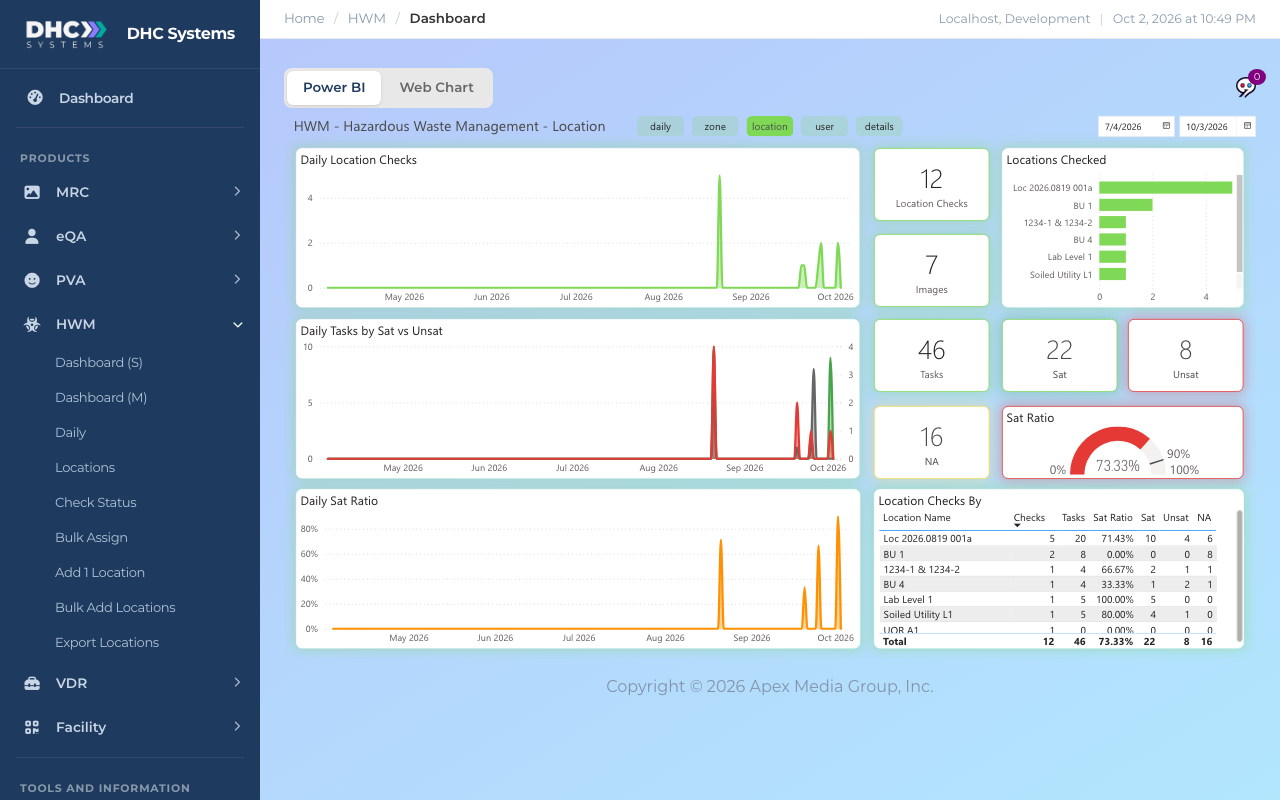
The Daily report on the location tab with a Locations Checked bar chart and a per-location table showing Lab Level 1 at 100% and Soiled Utility L1 at 80%
The location tab

user

The person chart again, plus a day-of-week by hour grid that shows when your checks actually happen. Handy for seeing if a shift is being missed.
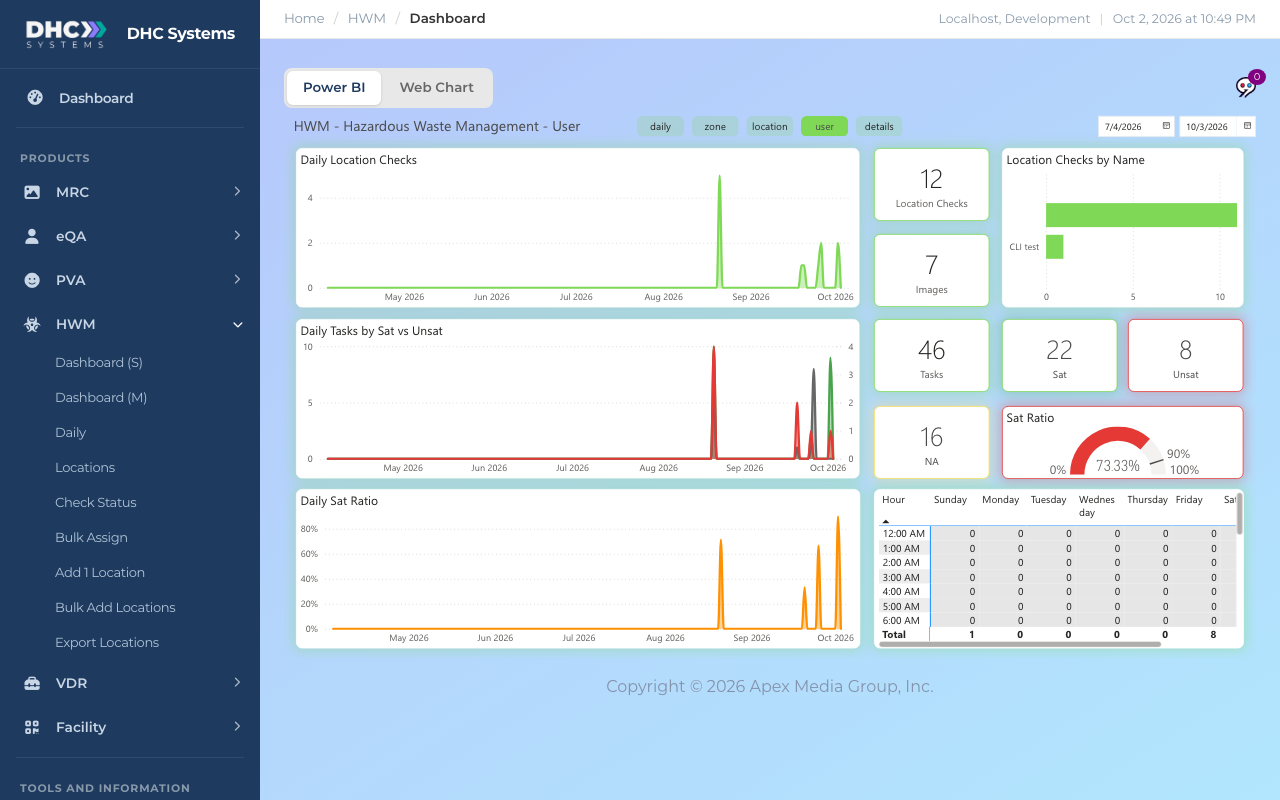
The Daily report on the user tab with a grid of hours down the side and days of the week across the top
The user tab’s hour-by-day grid

details

Every scan in the range, one per row, in the QA List: when it was completed, zone, location, who checked it and their ID, Sat Ratio, Sat, Unsat, whether an image was attached, and the scan number. Click a row and the Scan Details card on the right fills in with the photo (or “No image available”), the zone and location, the person, the Sat and UnSat totals, each task’s answer and any notes.
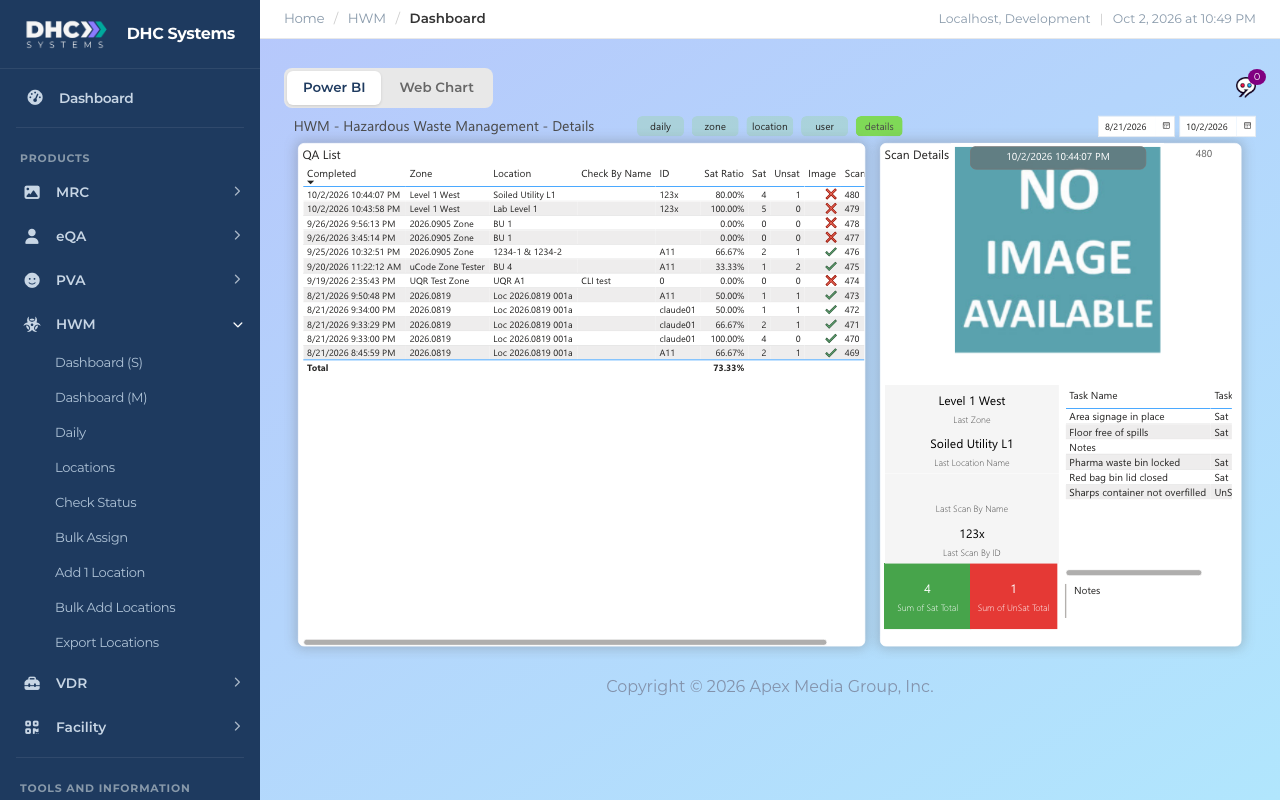
The Daily report on the details tab with the QA List of scans on the left and a Scan Details card on the right showing Soiled Utility L1, the task answers and a No Image Available placeholder
The details tab: pick a scan on the left, see everything about it on the right

Print Page and Help

Two buttons sit above the report. Print Page prints the report page you are looking at, in landscape, with the sidebar and menus left out. In the Chrome print dialog open More settings and tick Background graphics so the colored tiles print. Help opens a short guide to the page without leaving it: how to read the charts, how the filters work, and what to do if the data looks out of date. For anything else, ask Sage from the sidebar.

The top of a reporting page with the Power BI and Web Chart tabs, the Print Page button and the Help button
Print Page and Help sit above every product report.

Who can do this

M1 accounts and Directors (M2).

Tips

  • The details tab has its own date range. If it looks empty, check the dates in its top right corner.
  • In the QA List, click the Sat Ratio heading to sort. The lowest scores float to the top so you can review the misses first.
  • The report is slow on the very first load of the day. Give it up to a minute before refreshing.
Share This Article

Leave a Comment