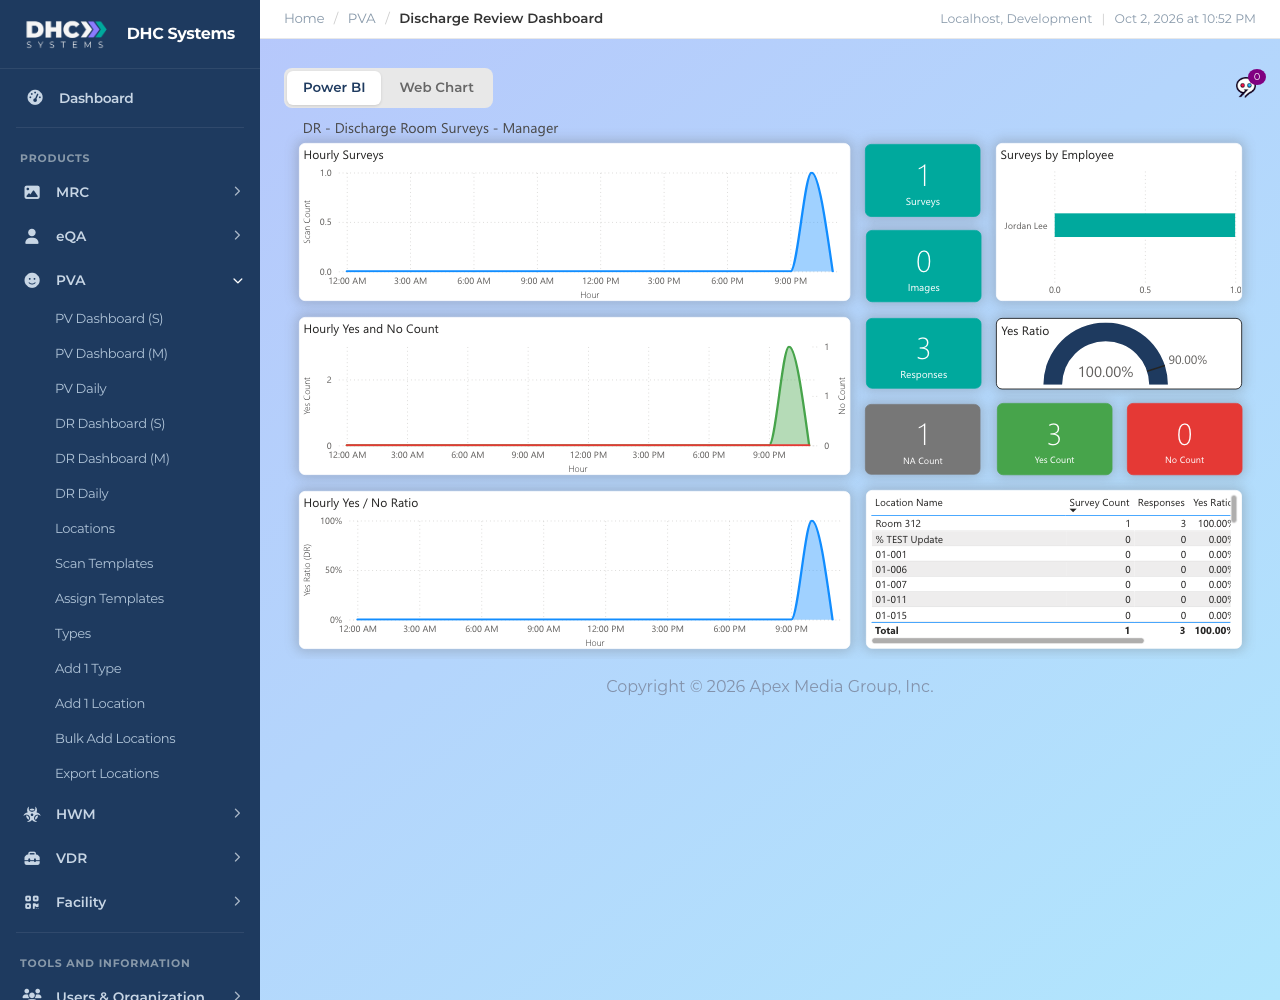
DR Dashboard (M) is the manager’s view of today’s discharge checks. On top of the (S) page it tells you who did the checks, which rooms were covered, how many items were marked NA and how many photos were attached.
The manager view adds employees, locations, NA and images
How to open it
In the sidebar click PVA, then DR Dashboard (M).
Give it a few seconds to draw.
What is on the page
Hourly Surveys, Hourly Yes and No Count, Hourly Yes / No Ratio: today by hour.
Surveys: discharge checks today.
Images: photos uploaded from the thank you screen today.
Responses: checklist answers today.
NA Count: answers given as NA or N/A. These are left out of the Yes ratio.
Yes Count and No Count: Yes (or SAT) and No (or UNSAT) answers.
Yes Ratio: Yes divided by Yes plus No, against a 90% mark.
Surveys by Employee: a bar per Completed By Name.
The table at the bottom right: one row per room with Location Name, Survey Count, Responses and Yes Ratio, plus a Total row. Rooms with no check today show zeros.
Who can do this
M1 accounts and Directors (M2).
Tips
Sort the table by Survey Count to see which rooms were turned over today and which were not.
A high NA Count on a room usually means a checklist item does not apply there. Consider a separate Scan Template for that kind of room.
Photos are counted here but viewed on DR Daily, details tab.