
DHC Systems Guide

DHC Systems Guide

Did You Know?

The Dashboard is the first page you see after signing in. It shows one Snapshot tile for each product your company uses, so in a few seconds you know whether today’s work is happening and how it is going. The tiles load straight from the database, so the page is quick, even on a phone.
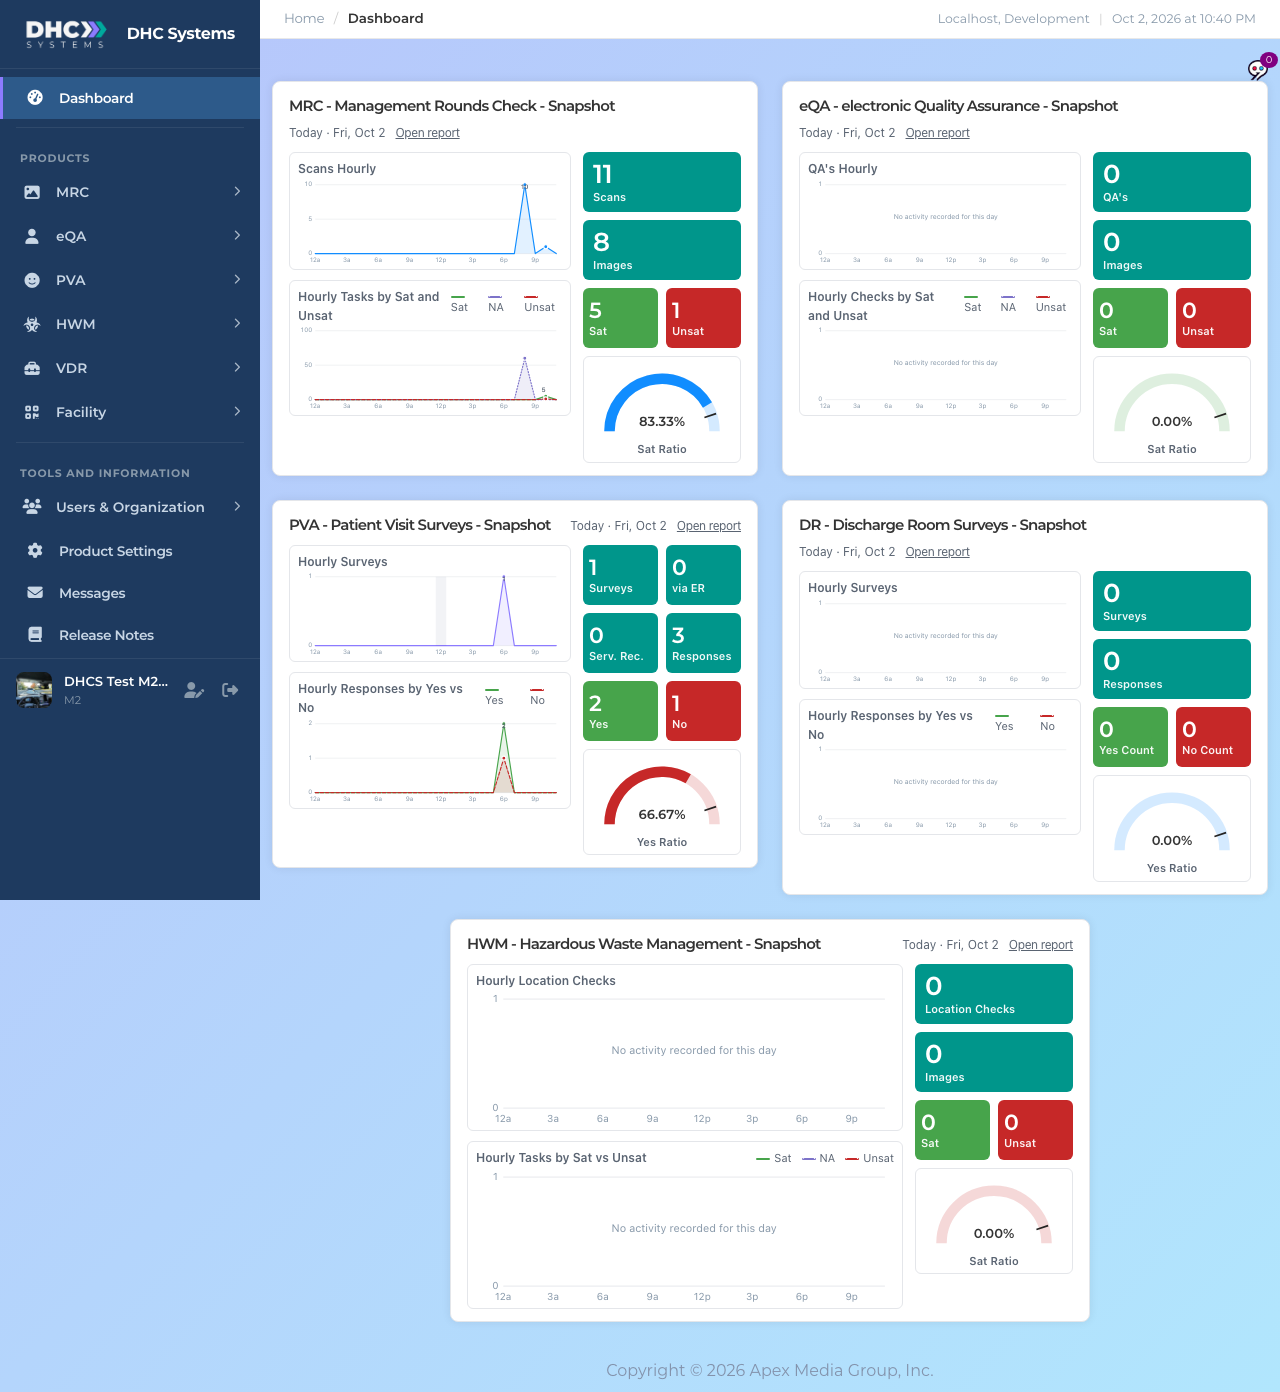
The v4 Dashboard with snapshot tiles for MRC, eQA, PVA Patient Visit Surveys, DR Discharge Room Surveys and HWM, each with two charts, coloured stat tiles and a gauge
The Dashboard for a company with all products. Your page shows only the products you have.

Which day a tile shows

Each tile covers one day in your company’s local time. It shows today if anything has been recorded today. If not, it falls back to yesterday and the header says Latest activity instead of Today. If there was nothing on either day you see Today with zeros and the charts say “No activity recorded for this day”. The header also has an Open report link that takes you to that product’s full report pages.

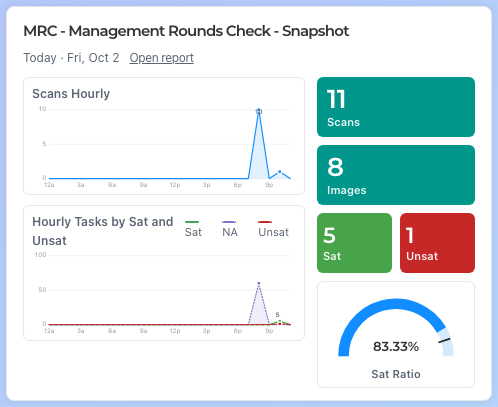
A tile header reading MRC - Management Rounds Check - Snapshot, Today · Fri, Oct 2 and an Open report link
The tile header: the product, the day shown and the Open report link.

What is on a tile

The MRC snapshot tile with the Scans Hourly chart, the Hourly Tasks by Sat and Unsat chart, teal, green and red stat tiles and a Sat Ratio gauge
One complete tile. Charts on the left, numbers on the right.

The two hourly charts

The upper chart counts how many scans, checks or surveys were completed in each hour of the day, from 12a to 11p. The lower chart breaks the answers inside those scans into their outcomes for each hour. Hover over any hour on a computer to see the exact numbers. The highest point is labelled.

  • MRC: Scans Hourly, then Hourly Tasks by Sat and Unsat.
  • eQA: QA’s Hourly, then Hourly Checks by Sat and Unsat.
  • HWM: Hourly Location Checks, then Hourly Tasks by Sat vs Unsat.
  • PVA has two tiles, Patient Visit Surveys (PV) and Discharge Room Surveys (DR). Both show Hourly Surveys, then Hourly Responses by Yes vs No.

In the lower chart green is Sat (or Yes), red with a dashed line is Unsat (or No), and purple dotted is NA. The hour used is when the scan was finished for MRC, eQA and HWM, and when the survey was started for PV and DR.
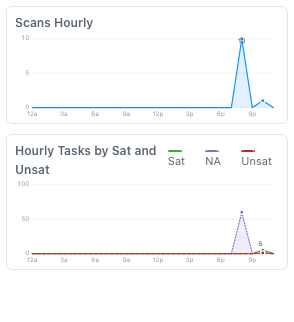
The two charts from the MRC tile: a single blue line for scans per hour, and green, purple and red lines for Sat, NA and Unsat tasks per hour
Hourly charts. The legend on the second chart names the three outcomes.

The stat tiles

The coloured boxes are the totals for the day shown. Teal boxes are counts, green is good, red needs attention.

  • MRC, eQA and HWM: Scans (or QA’s, or Location Checks), Images attached, then Sat and Unsat task totals.
  • Patient Visit Surveys (PV): Surveys, via ER (patients who came through the emergency room), Serv. Rec. (visits where service recovery was needed), Responses, then Yes and No.
  • Discharge Room Surveys (DR): Surveys, Responses, then Yes Count and No Count.

The gauge

The half circle is the Sat Ratio (Sat divided by Sat plus Unsat) or the Yes Ratio (Yes divided by Yes plus No). NA answers are left out. The small black tick is the 90% target. On the PVA Patient Visit and HWM tiles the arc turns green at 90% or above, amber from 70%, and red below that. The other tiles keep one colour. With no answers yet the gauge reads 0.00%.
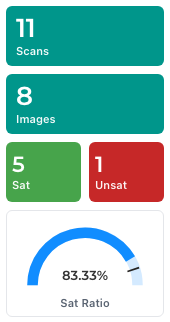
Stat tiles reading 11 Scans, 8 Images, 5 Sat, 1 Unsat and a blue gauge at 83.33% Sat Ratio with a target tick near 90%
Stat tiles and the gauge. The tick marks the 90% target.

On a phone

Tiles stack in one column. The charts come first, then the stat tiles in a row, then the gauge. Scroll down for the next product. Pull to refresh to update the numbers.
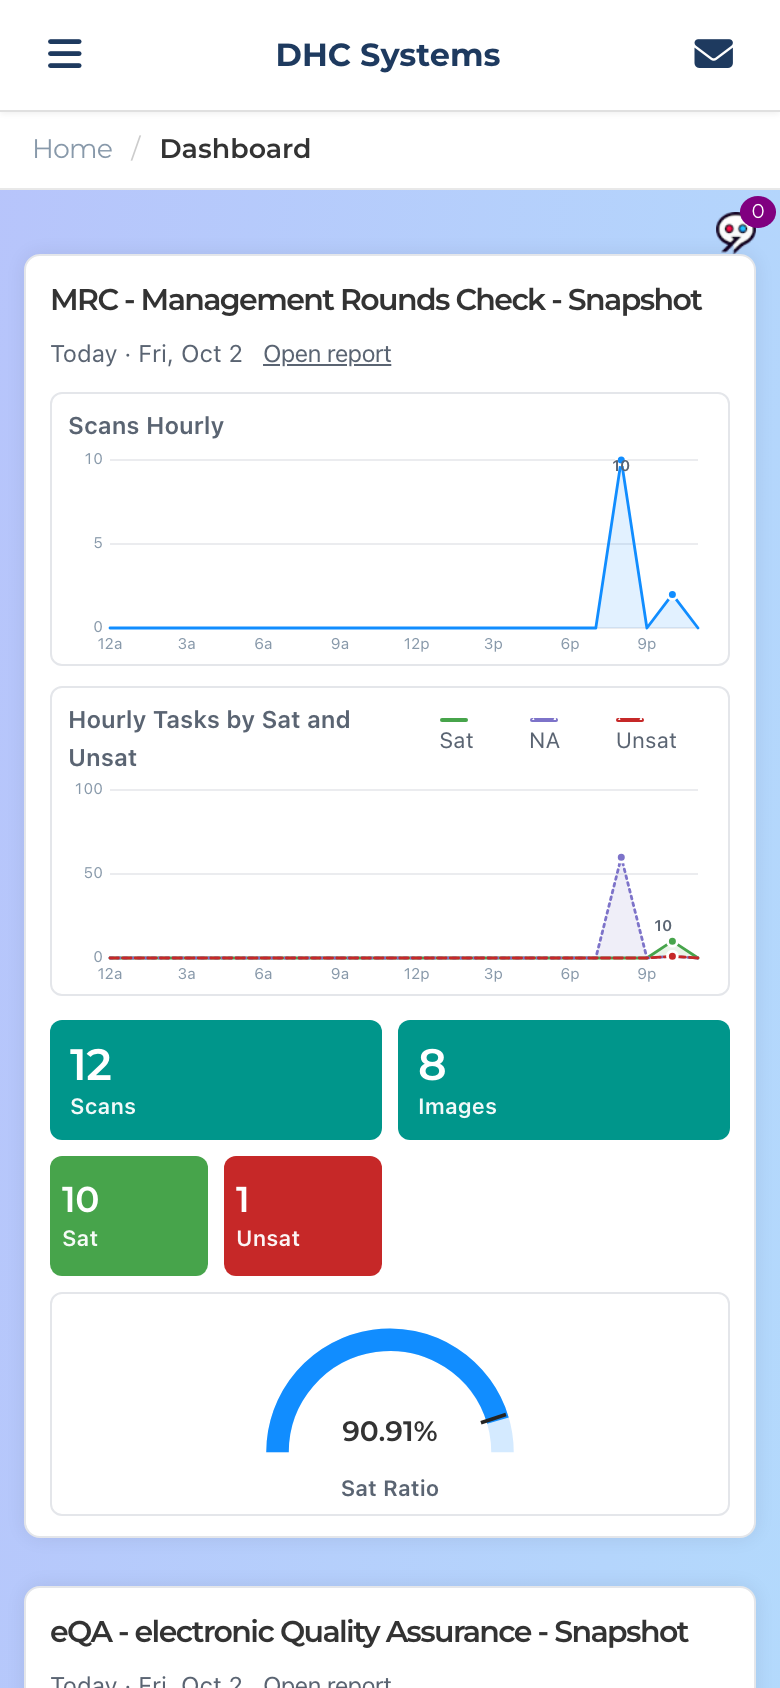
The Dashboard on a phone with the MRC tile filling the width: charts above, stat tiles below, gauge at the bottom
The same MRC tile on a phone.

Where the full reports are

The Dashboard is a snapshot, not a report. For filtering, history and detail open the product group in the sidebar and use its report pages: Dashboard (S) for everyone, Dashboard (M) and Daily for M1 accounts and Directors (M2). Each product’s section of this guide explains its reports. The Open report link on a tile takes you to the same place.

Announcements from DHC Systems also show up on the Dashboard when you have something unread. See the article Messages.

Who can do this

Everyone. IC accounts, M1 accounts and Directors (M2) see the same tiles for the products their company uses, always for their own company only.

Tips

  • The numbers match the reports exactly, so a quick glance here is enough for a shift handover.
  • A tile stuck at zero in the afternoon usually means scans are not getting through. Check with the team before you check the system.
  • If a tile ever says “Live counts are unavailable right now”, refresh in a moment. The data is safe, the page just could not reach it.
  • Images count only for products whose scan pages take photos. See the article Product Settings for how to require a photo.
Share This Article

Leave a Comment