eQA – Admin – Reporting
This report is available by expanding the “eQA – Admin” section and clicking “Reporting”
eQA – Admin – Reporting – Today
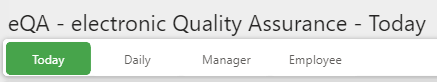
The first page that loads is for “Today”
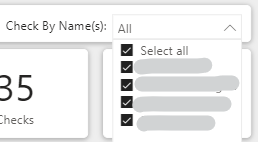
The far right of the report navigation bar allows the user to “Check By Name(s):”.
This allows for filtering the contents of the page to a specific Employee Name. You can select one, or more, or all.
Note: Since this page is specific to “Today”, only Employees that had scans for the day will be in the drop-down list.

The upper left chart is the “Hourly QA’s” and allows for the user to examine the number of QA’s performed by hour for the day.
Hovering over a datapoint will provide tooltip showing the details.
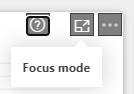
You can also hover your mouse over the upper right corner to reveal “Focus mode”. Clicking this will open the chart in a larger view.
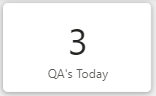
In the upper row of the page, the first tile is a count of the "QA's Today". This displays the number of QA's that have been completed for the day.
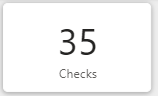
Next to the QA count is “Checks” which provides the number of Checks completed for the day, or for the period of the report.
Remember a QA can have up to 25 Checks associated with it.
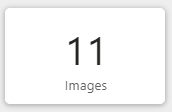
The final tile, is the number of images uploaded for the period of the report.
As with the other tiles, and sections within this page, if a period of one month was selected, it is the images uploaded for the month. If a year was selected, it is the number of uploaded images for the year.
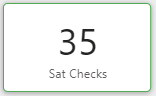
Next we will have a look at the tile labeled “Sat Checks”. This is a count of the “Sat”, or Satisfactory, Checks that were completed for the period of the report.
Adding “Sat Checks” and “UnSat Checks” will equal the value in the “Checks” tile.
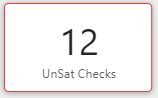
After the Sat Checks tile, you will find “UnSat Checks”. This is a count of the “UnSat”, or Unsatisfactory, Checks that were completed for the period of the report.
Adding “Sat Checks” and “UnSat Checks” will equal the value in the “Checks” tile.
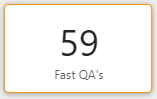
The last tile in this section is the “Fast QA's” that were flagged over the period of the report.
If the report is a "Today" report then it would be the Fast QA's for today, or if the report period was one month, it would be the Fast QA's for the selected month.
Please refer to the “Terminology” article for any definitions that are unfamiliar.
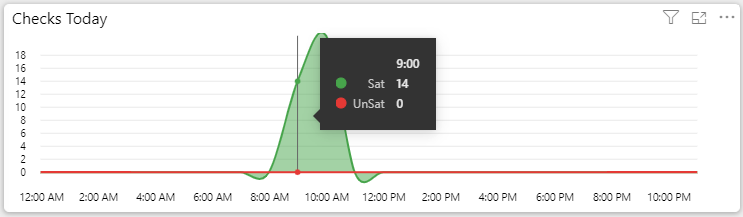
The "Checks Today" is located below the QA's Today in the reporting Dashboard for eQA and shows the number of Checks that have been conducted as part of the QA's for the day.
Any QA can have up to 25 Checks to be done.
Like other reports, hovering over a datapoint will display the numbers behind the report.
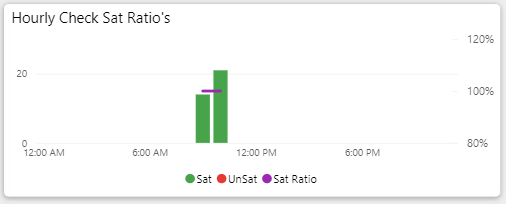
There are two different views for Hourly Checks with the second version showing in the eQA - Admin - Reporting pages.
Each with similar information, however, the Reporting version also includes the Ratio in the bar chart.
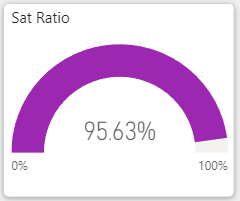
The next card we will look at is the Sat Ratio.
This is a gauge charts that show the percentage of Satisfactory Checks for the period of the report.
It is a ratio of Sat Checks / Total Checks.
Close to 100% is ideal, however, too close to 100% can indicate more attention to detail is needed during QA's and Check completion.
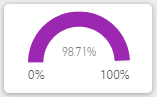
Depending on where Sat Ratio is being used, it may also appear as a smaller chart.
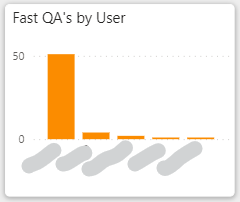
The next chart we will look at is “Fast QA's by User”. As indicated in the title of the chart, it is the “Fast QA's” that were flagged in the system for the period of the report, by User.
Similar to other charts and graphs, try clicking the bar above the User to filter some of the other charts and records on the page.
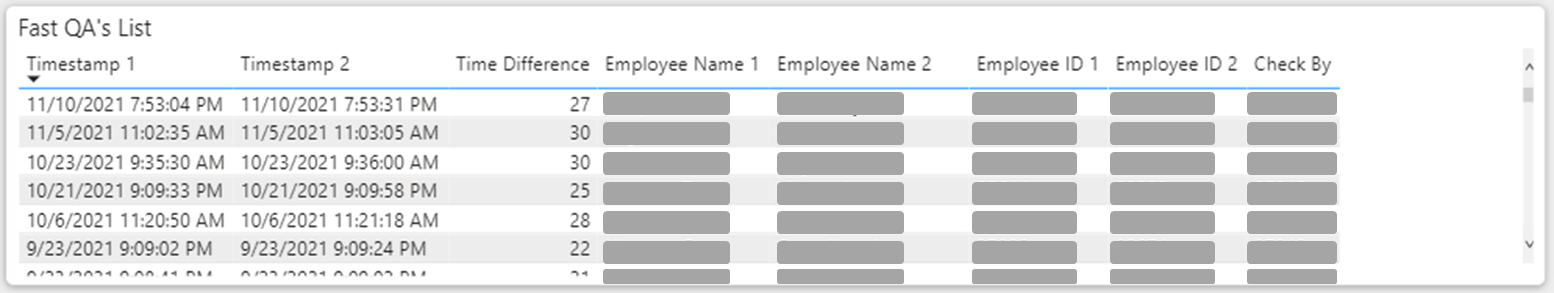
The third row is covered by a single table of information. This is the "Fast QA's List" where the user will see the times of the QA's, the difference in time, the Employees that were Checked, and who conducted the fast QA's.
Again, these are all the Fast QA's for the period of the report.
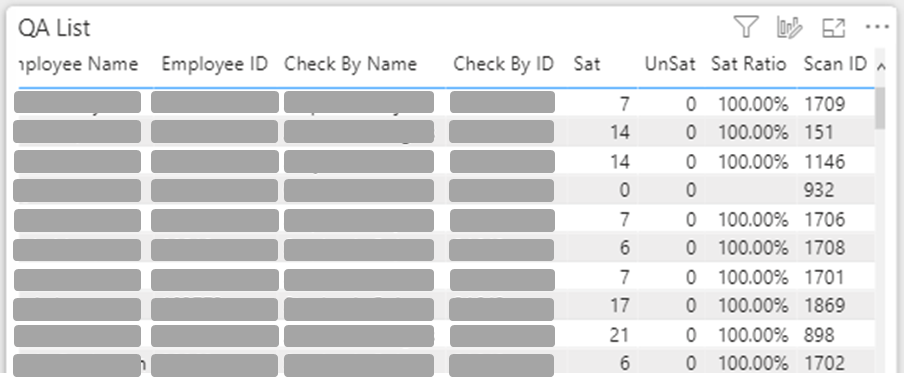
The large table of information on the lower left corner is the "QA List". This is a list of each of the QA's that have been completed for the period of the report.
Click a row within this table to show the details, including the image in the visual to the right.
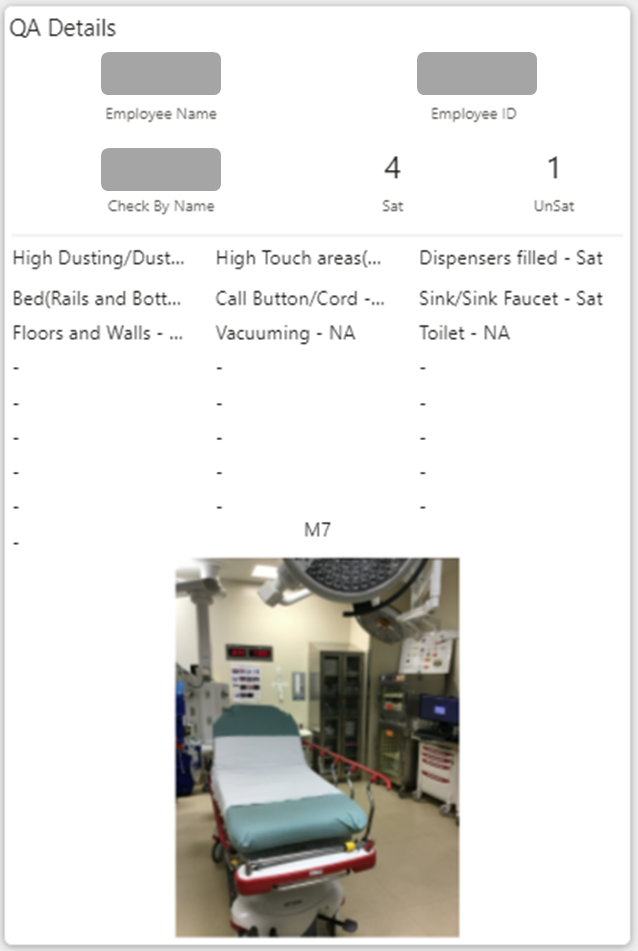
The final part of the page is the “QA Details” card.
When the user selects one of the rows in the “QA List” the details of that QA, including the image, will be displayed in the “QA Details” card.
In this example, you would hover your mouse over "High Dusting/Dust..." to see that it was marked "Unsat". In the rest of the card, you see some notes about the QA.
Perfect example of how to best leverage the system.
To see a different record, simply click another row in the "QA List".