Welcome to the Management Rounds Check (MRC) Product within DHC Systems.
In this document you will find all the information you need to sign up, sign in, navigate, and use MRC.
- finding help/instructions
- navigating
- terminology
- dashboards
- reporting
- data out of date
- adding scans
- add 1 scan
- bulk add scans
- creating barcodes/qr codes
- editing barcodes/qr codes
- printing barcodes/qr codes
- scanning barcodes/qr codes
- getting help
Help and Support
We try to make finding help and support within DHC Systems simple, straightforward, and accessible.
Within the system, keep an eye out for the following icons, buttons, and calls-to-action:
Page Help buttons will open information about the page that you are on, next steps, common terminology, and other information relevant to actions that can be performed from the page you are on. In some cases there will be a link to more detailed instructions that can be printed or opened in another window.

Question (?) mark icons will provide a brief description of what is in the tile, column, or other object within the user interface.


Get Started with <product name here> will open an instruction window and/or a window that allows you to open the detailed instructions in another window.

You can also find instructions on the main site at DHCSystems.com .
We are also always monitoring email at gmgllc@outlook.com for high priority issues, escalations, or general questions.
Service Level Agreement (SLA):
- High priority issues, such as scan failures, upload failures, and outages: 1 hour
- Medium priority requests and system troubleshooting: 4 hours
- Low priority, general questions, information requests, and other non-critical issues: 24 hours
We are also available via the phone number at the top of the page for immediate requests and questions.
Terminology of MRC
Management Rounds Check, known as MRC, is real-time monitoring and reporting of staff activities around the facility.
Check the status of a room, or location, in the facility to see when it was last cleaned. See an image of the last time it was checked. Monitor for "UnSat" checks to spot areas that need attention.
MRC is a great way to manage the facility and audit rooms when issues arise. With images and timestamps, it offers a great paper trail.
MRC Specific Terminology
- Scan: A "Scan" is the barcode, or qr code, that is scanned. This is generally a room or location in the facility. Areas such as Operating Room, Lobby, or Waiting Room would all be examples of different "Scan"s. A "Scan" will almost always have more than one "Task" assigned to it. Each "Scan" can have up to 25 "Task"s assigned to it.
- Task: A "Task" is the item, or task, that is to be checked in the room or location. Essentially, the tasks are the checklist to be done after each scan. For example, within a Patient Room, you may have a task for "Dusting", another for "Sharps", and another for "Floor". A "Scan" can have up to 25 "Task"s assigned to it.
- Zone: The "Zone" where the room or area of the facility is located. This reporting feature can be useful when grouping tasks and scans based on a wing of a hospital, for example.
- Architectual Number: The Architectural Number is the name of the room, or area, where the task is to take place. Some Architectural Number examples would be "OR Room 1", "Pediatrics Bays", or "Surgery/Trauma".
- Fast Scans: When two, or more, different "Scan"s are logged by the same individual within a very short period of time, they are flagged as a "Fast Scan".
Navigation - MRC
The navigation bar will appear on the left side when on a PC or Mac, and on the right side when on a mobile device.
On mobile, you may see a hamburger menu to expand the navigation: 
Depending on your role, you will see one or two sections to the MRC navigation. Clicking the triangle will expand and collapse the navigation:
When first loaded, the menu will be collapsed. Here we are looking at the MRC - Admin section
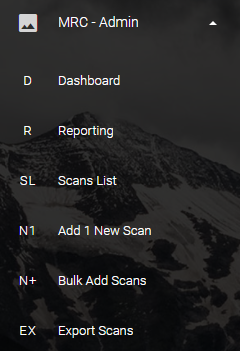
Clicking the triangle will expand the menu to reveal the sections available to you.
MRC - Admin has the following available:
- Dashboard - High-level view of activities and status of Scans and Tasks.
- Reporting - Detailed report offerings to deep dive on scans, tasks, and images.
- Scans List - Displays all the scans available in the system with some detail.
- Add 1 New Scan - Access the form to add 1 new scan to the system.
- Bulk Add Scans - Add multiple scans into the system with a single upload
- Export Scans - Open a page that displays the barcodes/QR codes available to print, stick, and scan.
The other section is labeled "MRC - Standard".
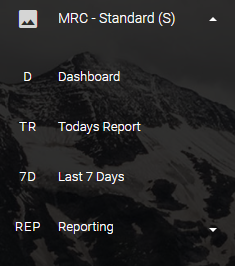
Clicking the triangle will expand the menu to reveal additional sections.
MRC - Standard has the following available:
- Dashboard - High-level view of activities and status of Scans and Tasks.
- Todays Report - Detailed report of the scans, tasks, and images for Today.
- Last 7 Days - Detailed report of the scans, tasks, and images for the last 7 days.
- Reporting - Click to expand a list of shortcuts to report on "Today", "Last 2 Days", "Last 7 Days" and "Last 30 Days".
The Management Rounds Check (MRC) Dashboard comes in a few different flavors.
The one that you will come across most frequently is powered by Power BI, a premium Microsoft technology. The other Dashboard you will come across is based on bootstrap and JavaScript technologies.
Both have their purposes, and we will dive deeper into the sections within the Dashboards below.
Any Dashboard, or page for that matter, can be printed using the "Print Page" button in the upper right corner of the page.

Power BI Dashboards
The first Dashboard that you are presented with after logging in to DHC Systems uses Power BI. This Dashboard gives you a top level view for the day, as well as Sat and UnSat Tasks for the last 15 days. MRC appears on the page first, followed by eQA below that.
You can also access this initial Dashboard any time after logging in by clicking "Dashboard" in the navigation bar: 
Next, we will go through each section of the Dashboard for MRC. We will start from the top left, work our way right, then down, to the right, and down to the larger chart.

The top left visual is the "Scans Today" chart. Here you should see an hour-by-hour count of the total scans conducted.

You can hover over any datapoint to see the actual value.
You can also hover your mouse over the upper right corner to reveal "Focus mode". Clicking this will open the chart in a larger view.
The upper right consists of six tiles. The first show a count of "Scans Today" which displays the number of scans that were conducted.
Next to the Scans is "Tasks Today" which provides the number of Tasks completed for the day. Remember a Scan can have up to 25 Tasks associated with it.
The last tile of the row is the number of "Images" that have been uploaded for the day. Each scan that is submitted into the system has the opportunity to have an image attached.

Below the "Scans Today" tile you will see "Sat Today" This is a count of the "Sat", or Satisfactory, Tasks that were completed for the day. Adding "Sat Today" and "UnSat Today" will equal the value in the "Tasks Today" tile.
After the Sat Tasks count you will find the "UnSat Today" count. This is the number of "UnSat" or Unsatisfactory Tasks for the day.
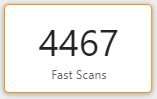
The last tile in this section is the "Fast" Scans that were flagged for the day. Please refer to the "Terminology" article for any definitions that are unfamiliar.

The large chart in the second row is the "Tasks Today" record. Here you will see the number of tasks conducted throughout the day. Green represents "Sat Tasks" and Red represents "UnSat Tasks".
You will also notice that hovering over a data point provides additional detail.

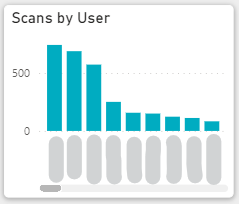
Moving to the right from the "Tasks Today" chart you will see "Scans by User Last 15 Days". This will provide a breakdown of the total number of Scans conducted by each person within your organization.
Try clicking the bar above a User. It will filter the "Scans Today", "Tasks Today", and "Last 15 Days Task Sat vs UnSat" for the selected User.
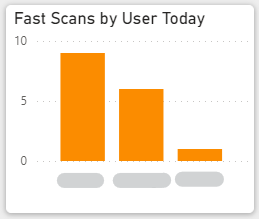
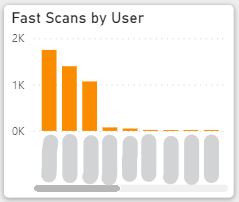
The next tile is "Fast Scans by User Today". As indicated in the title of the chart, it is the "Fast Scans" that were flagged in the system for the day, by User.
Similar to the previous tile, try clicking the bar above the User to filter some of the other charts.

The final chart on the main Dashboard is the "Last 15 Days Task Sat vs UnSat". As the title implies, it is the activity of Tasks over the last 15 days. Hovering over any of the data points reveals the details of the Sat and UnSat, including the date.
BootStrap and JavaScript Dashboards
BootStrap and JavaScript Dashboards bring some different strengths from the Power BI Dashboards, however, there are some tradeoffs.
Below we will describe each of the types of visuals, and the functionality, you will find within these types of Dashboards.

One of the larger charts you come across in MRC will show you "Hourly Usage".
Similar to the Power BI reports, hovering over a datapoint will bring up additional detail of the data.
Below the chart, you can also see a brief description that summarizes the activity for the day.

As referenced in the "Help and Support" article, hovering your mouse over the "?" icon brings up a tooltip for the card.

The upper right consists of six cards. The first show a count of "Scans Today" which displays the number of scans that were conducted.

Next to the Scans is "Tasks Today" which provides the number of Tasks completed for the day. Remember a Scan can have up to 25 Tasks associated with it.

The last tile of the row is the number of "Images" that have been uploaded for the day. Each scan that is submitted into the system has the opportunity to have an image attached.

Below the "Scans Today" card you will see "Sat Today" This is a count of the "Sat", or Satisfactory, Tasks that were completed for the day. Adding "Sat Today" and "UnSat Today" will equal the value in the "Tasks Today" card.

After the Sat Tasks count you will find the "UnSat Today" count. This is the number of "UnSat" or Unsatisfactory Tasks for the day.

The last tile in this section is the "Fast Scans" that were flagged for the day. Please refer to the "Terminology" article for any definitions that are unfamiliar.
MRC - Admin - Reporting
This report is available by expanding the "MRC - Admin" section and clicking "Reporting"
MRC - Admin - Reporting - Today

The first page that loads is for "Today"

The far right of the report navigation bar allows the user to "Choose Zone(s):".
This allows for filtering the contents of the page to a specific Zone.
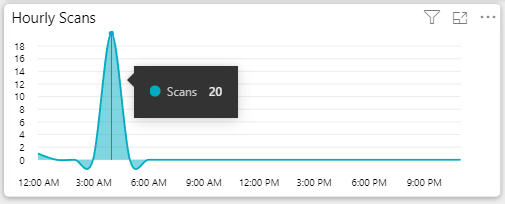
The upper right chart is the "Hourly Scans" and allows for the user to examine the number of scans performed by hour for the day.
Hovering over a datapoint will provide tooltip showing the details.

You can also hover your mouse over the upper right corner to reveal “Focus mode”. Clicking this will open the chart in a larger view.

Like in the Dashboard, the upper right consists of six tiles. The first show a count of “Scans Today” which displays the number of scans that were conducted.

Next to the Scans is “Tasks Today” which provides the number of Tasks completed for the day. Remember a Scan can have up to 25 Tasks associated with it.

The last tile of the row is the number of “Images” that have been uploaded for the day. Each scan that is submitted into the system has the opportunity to have an image attached.

Below the “Scans Today” tile you will see “Sat Today” This is a count of the “Sat”, or Satisfactory, Tasks that were completed for the day. Adding “Sat Today” and “UnSat Today” will equal the value in the “Tasks Today” tile.

After the Sat Tasks count you will find the “UnSat Today” count. This is the number of “UnSat” or Unsatisfactory Tasks for the day.

The last tile in this section is the “Fast” Scans that were flagged for the day. Please refer to the “Terminology” article for any definitions that are unfamiliar.

The large chart in the second row is the “Hourly Tasks Sat vs UnSat” records. Here you will see the number of tasks conducted throughout the day. Green represents “Sat Tasks” and Red represents “UnSat Tasks”.

Moving to the right from the “Hourly Tasks...” chart you will see “Scans by User”. This will provide a breakdown of the total number of Scans conducted by each person within your organization.
Try clicking the bar above a User. It will filter the rest of the page for the selected User.

The next tile is “Fast Scans by User”. As indicated in the title of the chart, it is the “Fast Scans” that were flagged in the system for the day, by User.
Similar to the previous tile, try clicking the bar above the User to filter some of the other charts.
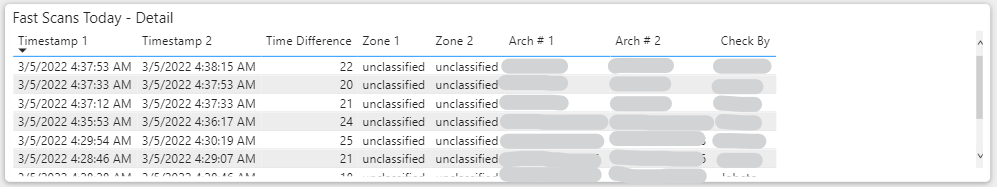
The third row is covered by a single table of information. This is the "Fast Scans Today - Detail" where the user will see the times of the scans, the difference in time, the Zones, areas and who conducted the fast scans.

The large table of information on the lower left corner is the "Scans Today - Detail". This is where each of the Scans conducted is listed.
Click a row within this table to show the details, including the image in the visual to the left.

The final part of the page is the "Scan Details" card.
When the user selects one of the rows in the "Scans Today - Detail" the details of that scan, including the image, will be displayed in the "Scan Details" card.
MRC - Admin - Reporting
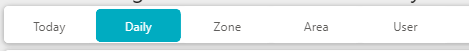
This report is available by expanding the "MRC - Admin" section and clicking "Reporting", then clicking the "Daily" button.
MRC - Admin - Reporting - Daily
Here you can see the details of the Scans and Tasks by Day.
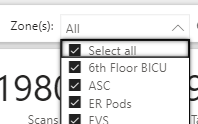
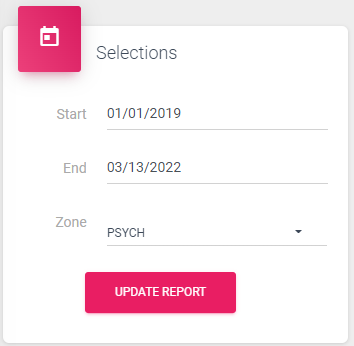
To the right the user can select specific "Zone(s):". Click the drop down and check, or uncheck, Zones of interest.
This allows for filtering the contents of the page to a specific Zone.
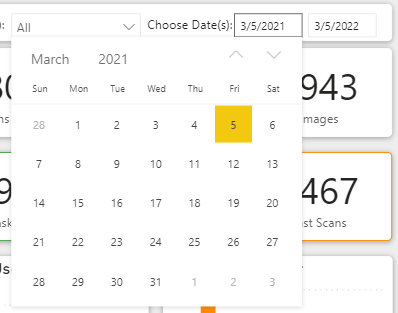
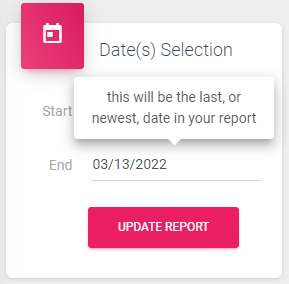
All the way to the right, there is a section for "Choose Date(s):". Clicking on the date will drop down a calendar to select the start date, and end date, for a report.
The user can also type directly in the date fields without the need to use the calendar selection method.
The report page will automatically update based on the selection.
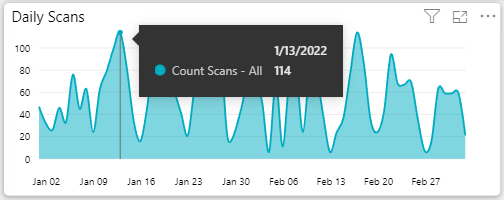
The first chart, in the upper left corner of the page, is the "Daily Scans".
This will show you the number of scans performed each day.
Like other reports, hovering over a datapoint will display the numbers behind the report.
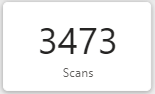
In the upper row of the page, the first tile is a count of the "Scans" done for the period of the report.
If you chose a month, it is the total scans for the month. If you chose one year, it is the total scans for the year.
In the upper row of the page, the second tile is the count of "Tasks" done for the period of the report.
As with the previous tile, if you chose a month, it is the total tasks for the month. If you chose one year, it is the total tasks for the year.
The final tile, is the number of images uploaded for the period of the report.
As with the other tiles, and sections within this page, if a period of one month was selected, it is the images uploaded for the month. If a year was selected, it is the number of uploaded images for the year.
Below the “Scans” tile you will see “Sat Tasks”. This is a count of the “Sat”, or Satisfactory, Tasks that were completed for the period of the report. Adding “Sat Tasks” and “UnSat Tasks” will equal the value in the “Tasks” tile.
After the Sat Tasks tile, you will find the “UnSat Tasks”. This is a count of the “UnSat”, or Unsatisfactory, Tasks that were completed for the period of the report. Adding “Sat Tasks” and “UnSat Tasks” will equal the value in the “Tasks” tile.
The last tile in this section is the “Fast Scans” that were flagged for the period of the report. Please refer to the “Terminology” article for any definitions that are unfamiliar.

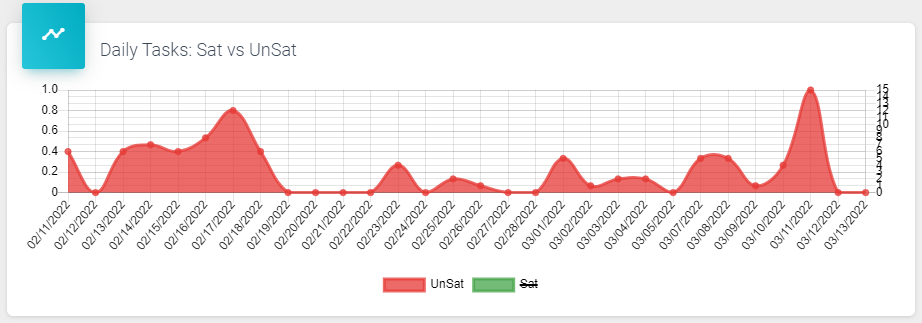
The large chart in the second row is the “Daily Tasks by Sat vs UnSat”. Here you will see the number of daily tasks conducted throughout the period of the report. Green represents “Sat Tasks” and Red represents “UnSat Tasks”.
Like the other charts, within most parts of the reporting and dashboards, hovering over the datapoint will provide additional detail and the numbers behind the chart.
Moving to the right from the "Daily Tasks..." chart you will see "Scans by User". This will provide a breakdown of the total number of Scans conducted by each person within your organization for the period of the report.
Try clicking the bar above a User. It will filter the page for the selected User.
The next tile is “Fast Scans by User”. As indicated in the title of the chart, it is the scans that were flagged in the system throughout the period of the report, by User.
Similar to the previous tile, try clicking the bar above the User to filter the other charts.

The third row is covered by a single table of information. This is the “Fast Scans – Detail” where the user will see the times of the scans, the difference in time, the Zones, areas and who conducted the fast scans.
Again, these are all the Fast Scans for the period of the report.
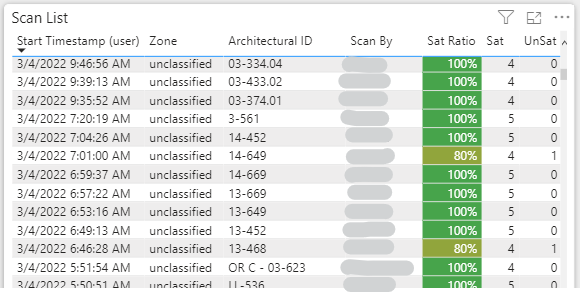
The large table of information on the lower left corner is the “Scan List”. This is where each of the Scans conducted for the period are listed.
Click a row within this table to show the details, including the image in the visual to the right.
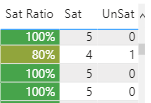
Also, note that the "Sat Ratio" within the "Scan List" uses conditional formatting to help highlight Scans that had a lower than 100% Satisfaction.
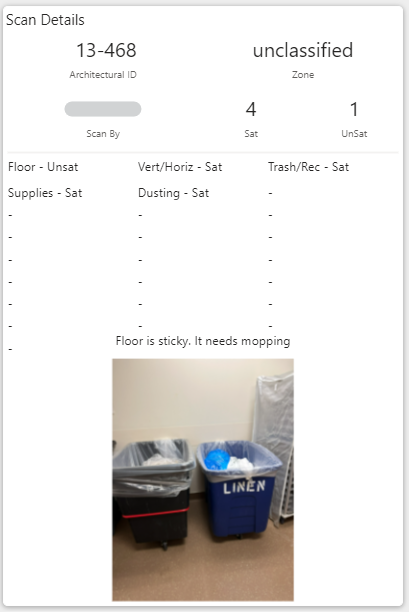
The final part of the page is the “Scan Details” card.
When the user selects one of the rows in the “Scan List” the details of that scan, including the image, will be displayed in the “Scan Details” card.
In this example, you can also see where "Floor" was marked "Unsat" with some notes about what needs to be done to correct it.
Perfect example of how to best leverage the system.
MRC – Admin – Reporting
This report is available by expanding the “MRC – Admin” section and clicking “Reporting”, then clicking the “Zone” button.
MRC – Admin – Reporting – Zone

Here you can see the details of the Scans and Tasks by Day and by Zone.

To the right the user can select specific "Zone(s):". Click the drop down and check, or uncheck, Zones of interest.
This allows for filtering the contents of the page to a specific Zone.

All the way to the right, there is a section for "Choose Date(s):".
Clicking on the date will drop down a calendar to select the start date, and end date, for a report.
The user can also type directly in the date fields without the need to use the calendar selection method.
Clicking the Month and Year will allow for moving up and down in the dates even quicker.
The report page will automatically update based on the selection.
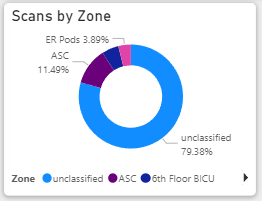
The first chart in the main body of the “Zone” page is the “Scans by Zone” donut chart.
This displays the percentage of scans that have occurred by Zone.
Hovering over the section of the donut will display the count, the percentage, and Zone it refers to.
Clicking a Zone will select it and filter the page for that zone.

Moving to the right you will see "Scans by User". This will provide a breakdown of the total number of Scans conducted by each person within your organization.
Try clicking the bar above a User. It will filter the rest of the page for the selected User.

In the upper row of the page, the first tile is a count of the "Scans" done for the period of the report.
If you chose a month, it is the total scans for the month. If you chose one year, it is the total scans for the year.

In the upper row of the page, the second tile is the count of "Tasks" done for the period of the report.
As with the previous tile, if you chose a month, it is the total tasks for the month. If you chose one year, it is the total tasks for the year.

The final tile, is the number of images uploaded for the period of the report.
As with the other tiles, and sections within this page, if a period of one month was selected, it is the images uploaded for the month. If a year was selected, it is the number of uploaded images for the year.

The next tile we will look at is the Sat Ratio.
This is a gauge chart that show the percentage of Satisfactory Tasks for the period of the report.
It is a ratio of Sat Tasks / Total Tasks.
Close to 100% is ideal, however, too close to 100% can indicate more attention to detail is needed during Task completion.

Next we will have a look at the tile labeled “Sat Tasks”. This is a count of the “Sat”, or Satisfactory, Tasks that were completed for the period of the report. Adding “Sat Tasks” and “UnSat Tasks” will equal the value in the “Tasks” tile.

After the Sat Tasks tile, you will find the “UnSat Tasks”. This is a count of the “UnSat”, or Unsatisfactory, Tasks that were completed for the period of the report.
Adding “Sat Tasks” and “UnSat Tasks” will equal the value in the “Tasks” tile.

Now lets look at one of the larger charts on the page.
The "Daily Scans" is located in the upper part of the page and gives an aggregate daily view of activity.
Like other reports, hovering over a datapoint will display the numbers behind the report.
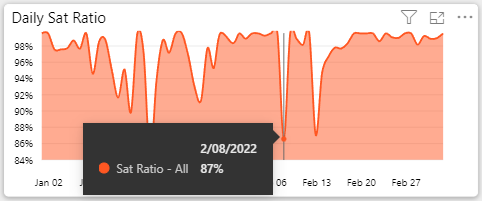
In the next chart we see "Daily Sat Ratio".
This is the daily ratio of the Satisfactory Percentage over the period of the report.
Go ahead and hover your mouse over a day to see specifics about the performance on a particular date.
100% would indicate that all Tasks checked for a day were Satisfactory.
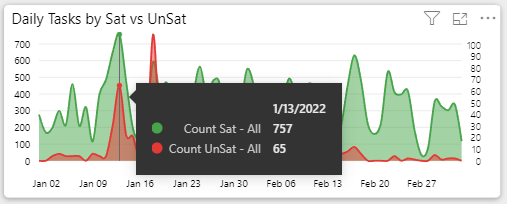
Another one of the large charts is the “Daily Tasks by Sat vs UnSat”.
Here you will see the number of daily tasks conducted throughout the period of the report. Green represents “Sat Tasks” and Red represents “UnSat Tasks”.
Like the other charts, within most parts of the reporting and dashboards, hovering over the datapoint will provide additional detail and the numbers behind the chart.
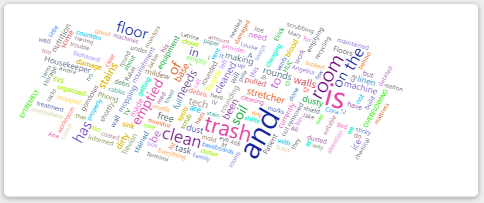
The visual with a bunch of words scattered around is the Word Cloud.
Words that are used more often in the Scan Notes appear larger. The smaller words are used in the Scan Notes less often.
Click a word to see the page filtered for Scans that included that word in the their notes.
It can be quiet enlightening for spotting trends.

The large table of information in the lower left is the “Scan List”. This is where each of the Scans conducted for the period are listed.
Click a row within this table to show the details, including the image in the visual to the right.

Also, note that the "Sat Ratio" within the "Scan List" uses conditional formatting to help highlight Scans that had a lower than 100% Satisfactory.
The more green, the higher the Satisfactory score. The more red, the lower the score.

The final part of the page is the “Scan Details” card.
When the user selects one of the rows in the “Scan List” the details of that scan, including the image, will be displayed in the “Scan Details” card.
In this example, you can also see where "Floor" was marked "Unsat" with some notes about what needs to be done to correct it.
Perfect example of how to best leverage the system.
To see a different record, simply click another row in the "Scan List".
MRC – Admin – Reporting
This report is available by expanding the “MRC – Admin” section and clicking “Reporting”, then clicking the “Area” button.
MRC – Admin – Reporting – Area

Here you can see the details of the Scans and Tasks by Day and by Area, or Architectural ID.
All the way to the right, there is a section for "Choose Date(s):".
Clicking on the date will drop down a calendar to select the start date, and end date, for a report.
The user can also type directly in the date fields without the need to use the calendar selection method.
Clicking the Month and Year will allow for moving up and down in the dates even quicker.
The report page will automatically update based on the selection.
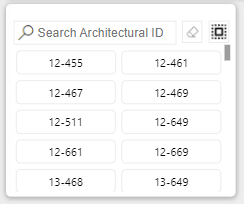
The first visual available in the main body of the “Area” page is the “Search Architectural ID” box.
Start typing the name of an Area and the list will automatically narrow to include what you are searching for.

Once the Area you are looking for shows in the box you can click it to filter the report.
You can click more than one Area by simply clicking the first, then click a another. Clicking a selected Area a second time will deselect it.
To reset the filter click the “Reset filter” button: ![]()
To select all of the search results click the “Select all” button: ![]()

The next card is the “Scans by Architectural ID”.
This chart provides the name of the Architectural ID and the number of Scans completed for it during the period of the report.
By default it shows the most scanned at the top going to the least scanned at the bottom.
Click one of the Architectural ID’s to select it and filter the page.
In the upper row of the page, the first tile is a count of the "Scans" done for the period of the report.
If you chose a month, it is the total scans for the month. If you chose one year, it is the total scans for the year.
In the upper row of the page, the second tile is the count of "Tasks" done for the period of the report.
As with the previous tile, if you chose a month, it is the total tasks for the month. If you chose one year, it is the total tasks for the year.
The final tile, is the number of images uploaded for the period of the report.
As with the other tiles, and sections within this page, if a period of one month was selected, it is the images uploaded for the month. If a year was selected, it is the number of uploaded images for the year.
The next tile we will look at is the Sat Ratio.
This is a gauge chart that show the percentage of Satisfactory Tasks for the period of the report.
It is a ratio of Sat Tasks / Total Tasks.
Close to 100% is ideal, however, too close to 100% can indicate more attention to detail is needed during Task completion.
Next we will have a look at the tile labeled “Sat Tasks”. This is a count of the “Sat”, or Satisfactory, Tasks that were completed for the period of the report. Adding “Sat Tasks” and “UnSat Tasks” will equal the value in the “Tasks” tile.
After the Sat Tasks tile, you will find the “UnSat Tasks”. This is a count of the “UnSat”, or Unsatisfactory, Tasks that were completed for the period of the report.
Adding “Sat Tasks” and “UnSat Tasks” will equal the value in the “Tasks” tile.
Now lets look at one of the larger charts on the page.
The "Daily Scans" is located in the upper part of the page and gives an aggregate daily view of activity.
Like other reports, hovering over a datapoint will display the numbers behind the report.
In the next chart we see "Daily Sat Ratio".
This is the daily ratio of the Satisfactory Percentage over the period of the report.
Go ahead and hover your mouse over a day to see specifics about the performance on a particular date.
100% would indicate that all Tasks checked for a day were Satisfactory.
Another one of the large charts is the “Daily Tasks by Sat vs UnSat”.
Here you will see the number of daily tasks conducted throughout the period of the report. Green represents “Sat Tasks” and Red represents “UnSat Tasks”.
Like the other charts, within most parts of the reporting and dashboards, hovering over the datapoint will provide additional detail and the numbers behind the chart.
The visual with a bunch of words scattered around is the Word Cloud.
Words that are used more often in the Scan Notes appear larger. The smaller words are used in the Scan Notes less often.
Click a word to see the page filtered for Scans that included that word in the their notes.
It can be quiet enlightening for spotting trends.
The large table of information in the lower left is the “Scan List”. This is where each of the Scans conducted for the period are listed.
Click a row within this table to show the details, including the image in the visual to the right.
Also, note that the "Sat Ratio" within the "Scan List" uses conditional formatting to help highlight Scans that had a lower than 100% Satisfactory.
The more green, the higher the Satisfactory score. The more red, the lower the score.
The final part of the page is the “Scan Details” card.
When the user selects one of the rows in the “Scan List” the details of that scan, including the image, will be displayed in the “Scan Details” card.
In this example, you can also see where "Floor" was marked "Unsat" with some notes about what needs to be done to correct it.
Perfect example of how to best leverage the system.
To see a different record, simply click another row in the "Scan List".
MRC – Admin – Reporting
This report is available by expanding the “MRC – Admin” section and clicking “Reporting”, then clicking the “User” button.
MRC – Admin – Reporting – User

Here you can see the details of the Scans and Tasks by Day and by User.
All the way to the right, there is a section for "Choose Date(s):".
Clicking on the date will drop down a calendar to select the start date, and end date, for a report.
The user can also type directly in the date fields without the need to use the calendar selection method.
Clicking the Month and Year will allow for moving up and down in the dates even quicker.
The report page will automatically update based on the selection.
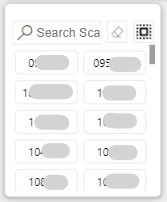
The first visual available in the main body of the “User” page is the “Search Scans for User” box.
Start typing the name of a User and the list will automatically narrow to include what you are searching for.
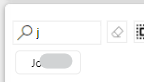
Once the User you are looking for shows in the box you can click it to filter the report.
You can click more than one User by simply clicking the first, then click a another. Clicking a selected User a second time will deselect it.
To reset the filter click the “Reset filter” button: ![]()
To select all of the search results click the “Select all” button: ![]()
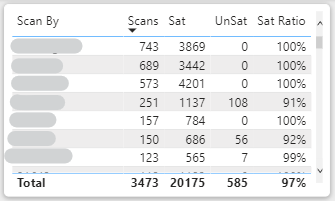
The next table is the “Scans by User”.
This table provides the name of the User, the number of Scans completed, Sat and UnSat Tasks, and the Sat Ratio during the period of the report.
By default it shows the User with the most scans at the top, going to the least scans at the bottom.
Click one of the Users to select them and filter the page.
In the upper row of the page, the first tile is a count of the "Scans" done for the period of the report.
If you chose a month, it is the total scans for the month. If you chose one year, it is the total scans for the year.
In the upper row of the page, the second tile is the count of "Tasks" done for the period of the report.
As with the previous tile, if you chose a month, it is the total tasks for the month. If you chose one year, it is the total tasks for the year.
The final tile, is the number of images uploaded for the period of the report.
As with the other tiles, and sections within this page, if a period of one month was selected, it is the images uploaded for the month. If a year was selected, it is the number of uploaded images for the year.
The next tile we will look at is the Sat Ratio.
This is a gauge chart that show the percentage of Satisfactory Tasks for the period of the report.
It is a ratio of Sat Tasks / Total Tasks.
Close to 100% is ideal, however, too close to 100% can indicate more attention to detail is needed during Task completion.
Next we will have a look at the tile labeled “Sat Tasks”. This is a count of the “Sat”, or Satisfactory, Tasks that were completed for the period of the report. Adding “Sat Tasks” and “UnSat Tasks” will equal the value in the “Tasks” tile.
After the Sat Tasks tile, you will find the “UnSat Tasks”. This is a count of the “UnSat”, or Unsatisfactory, Tasks that were completed for the period of the report.
Adding “Sat Tasks” and “UnSat Tasks” will equal the value in the “Tasks” tile.
Now lets look at one of the larger charts on the page.
The "Daily Scans" is located in the upper part of the page and gives an aggregate daily view of activity.
Like other reports, hovering over a datapoint will display the numbers behind the report.
In the next chart we see "Daily Sat Ratio".
This is the daily ratio of the Satisfactory Percentage over the period of the report.
Go ahead and hover your mouse over a day to see specifics about the performance on a particular date.
100% would indicate that all Tasks checked for a day were Satisfactory.
Another one of the large charts is the “Daily Tasks by Sat vs UnSat”.
Here you will see the number of daily tasks conducted throughout the period of the report. Green represents “Sat Tasks” and Red represents “UnSat Tasks”.
Like the other charts, within most parts of the reporting and dashboards, hovering over the datapoint will provide additional detail and the numbers behind the chart.
The visual with a bunch of words scattered around is the Word Cloud.
Words that are used more often in the Scan Notes appear larger. The smaller words are used in the Scan Notes less often.
Click a word to see the page filtered for Scans that included that word in the their notes.
It can be quiet enlightening for spotting trends.
The large table of information in the lower left is the “Scan List”. This is where each of the Scans conducted for the period are listed.
Click a row within this table to show the details, including the image in the visual to the right.
Also, note that the "Sat Ratio" within the "Scan List" uses conditional formatting to help highlight Scans that had a lower than 100% Satisfactory.
The more green, the higher the Satisfactory score. The more red, the lower the score.
The final part of the page is the “Scan Details” card.
When the user selects one of the rows in the “Scan List” the details of that scan, including the image, will be displayed in the “Scan Details” card.
In this example, you can also see where "Floor" was marked "Unsat" with some notes about what needs to be done to correct it.
Perfect example of how to best leverage the system.
To see a different record, simply click another row in the "Scan List".
MRC – Reporting – Day or Date Range
There are a number of ways to get to the MRC Reporting by Day, or Date Range.
Some of the most common are as follows:
- Clicking “Todays Report” from the navigation bar
- Clicking “Last 7 Days”, or variation of Last # Days, from the navigation bar
- Clicking a date, or date and timestamp, from different reporting tables
- Including the “Scan List” page.
MRC Single Day Reporting
Here you will see reporting for a single day. Hourly total scans as well as Sat and UnSat by hour.
The Top 10 Users shows the 10 users with the most scans for the day.
Want another day? Simply select or enter a different value in the “Date Selection” box and press “Update Report”.
As you use different reports across the system you may need to select a custom date, or date range. There are plenty of places that will quick link you to a date, such as "Today", or last 7 days, but there are times when you need something a little more specific of precise.
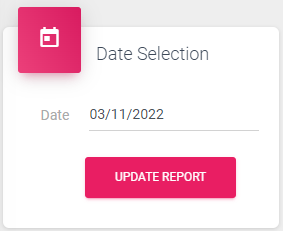
First, we will look at the "Date Selection".
This will allow you to choose one, single, day and is usually combined with reports that are at the hourly level.
Simply click in the "Date" field and either select the date from the calendar that pops out or type the date into the field.
After updating the date, click "Update Report".
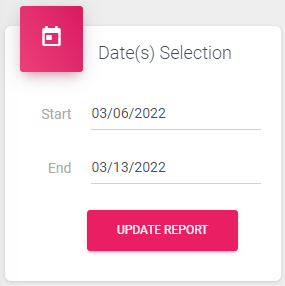
MRC Multi-Day, or Date Range, Reporting
Next, we will look at the multi-day selection process.
This is generally paired with reports that show a daily grain of reporting.
By default this report will select dates associated with the navigation selections. For example, if you click the "Last 7 Days" link, it would start on the date from a week ago, and end on todays date.
You can change those dates by clicking in the field next to the date you want to change, then selecting a new date from the dropdown, or typing the new date in manually.
After updating the dates, click "Update Report".
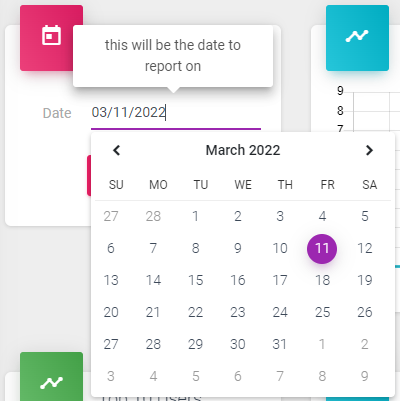
Notice, too, that when hovering your mouse, or clicking the field brings up a tooltip to help explain the purpose of the field. This is present in most locations around the system and products.
Various reports will include an hourly view to them in MRC. Below are a couple of the charts that you will come across when looking at reports that include an hourly view.
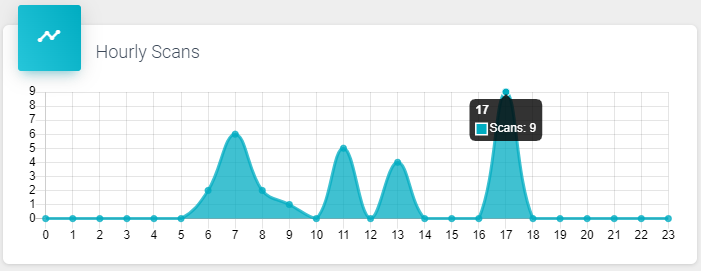
The first chart is the "Hourly Scans".
This shows the number scans done by hour for the period of the report.
Hovering over a datapoint will bring up the quantity of "Scans" for that hour.
The next chart we will explore is the "Hourly Tasks: Sat vs UnSat".
This chart shows the hourly Tasks that were completed for "Sat", or Satisfactory, shown in Green, and "UnSat", or Unsatisfactory, shown in Red.
Again, hovering over the datapoint will display the details of the information represented.
Also, represented in the chart is the Legend showing what each color represents. Try clicking "Sat" or "UnSat" to see the chart filtered.
Note that this is a feature across any report that includes a Legend. 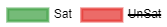
Top 10 is a pretty common part of reporting to help surface information of interest.
Here we are looking at the "Top 10 Users" bar chart.
This represents the Users who have completed the most Scans for the period of the report.
Hovering over the bar chart will display the User and the exact number of Scans they completed.
The area labeled "MRC Records for..." followed by a single date, or a date range, displays the aggregate information for each Scan completed for the period of the report.
Here is a definition of each of the fields, or columns, that appear in this table of information:
- Scan ID - When an item is created within the system it is given a unique number. That is what the scan id is.
- Zone - Multiple areas, or Architectural Numbers, can be assigned to a Zone. Click the Zone to see a report showing the Architectural Numbers and Areas within that Zone and performance over a period of time.
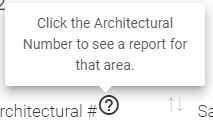
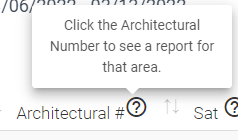
- Architectural # - Click the Architectural Number to see a report for that area.
- Sat - The number of Tasks or Checks for an area that were marked 'Sat'
- UnSat - The number of Tasks or Checks for an area that were marked 'UnSat'
- Image - Was an image attached by the user? If so, the kind of image will be displayed.
- Check By - This is who did the check. Click the value to see a report for that user.
- Timestamp - This is the last time this item was checked. Click the date to see the activity on that day.
- Action - Click 'View' to see the entries for the scan, including the image, if attached.
Here is a tip for using this table, and numerous other tables, within the system.
Try hovering your mouse over the question mark icon,  . A tooltip will appear to help let you know what else you can do from there.
MRC – Reporting – Architectural Report
The most common way to get to the “MRC Architectural Number Reporting” is to click on the “Architectural #” value within another report. Including the “Scan List” page.
MRC Architectural Number Reporting
Here you will see the reporting for a particular Architectural Number for the period of the report.
This combines the multi-day selection process with the entry of a Scan ID.
To update the report, perform the following steps:
- Click in the field next to the “Start” and select a new date from the calendar pop-up, or typing the new date in manually
- Click in the field next to the “End” and select a new date from the calendar pop-up, or typing the new date in manually
- In the “Scan ID” field, enter the number of the Architectural Number that you like to report on
- Click “Update Report”

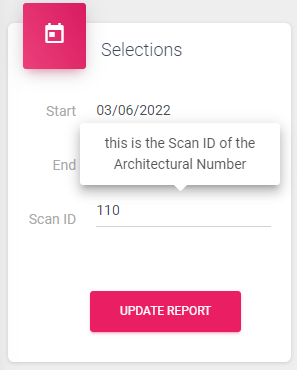
Notice, too, that when hovering your mouse, or clicking the field brings up a tooltip to help explain the purpose of the field. This is present in most locations around the system and products.
Various reports will include a daily view within MRC. Below are a couple of the charts that you will come across when looking at reports that include the daily, aggregated, view.
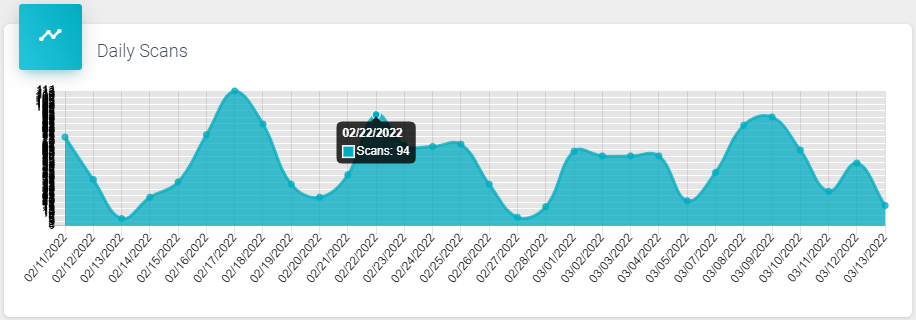
The first chart is the "Daily Scans".
This is the number scans done by day for the period of the report.
Hovering over a datapoint will bring up the quantity of "Scans" for that date.
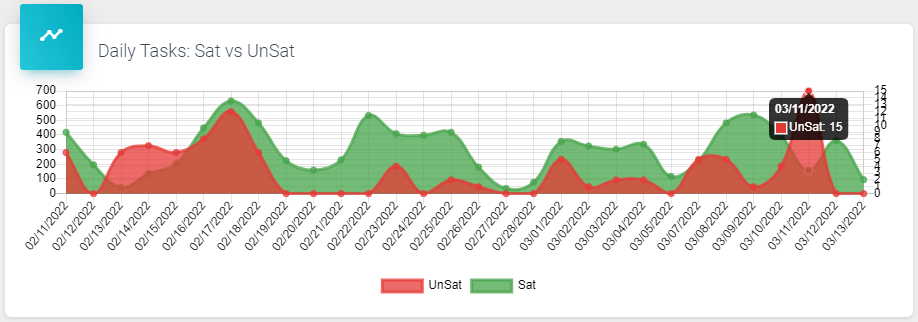
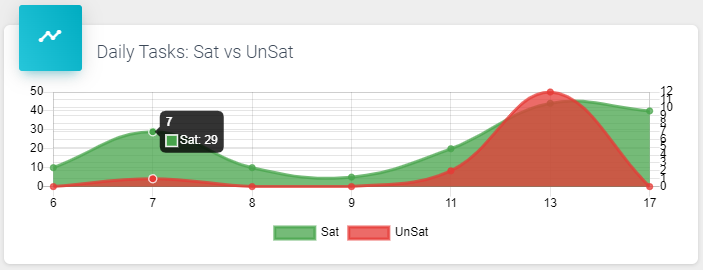
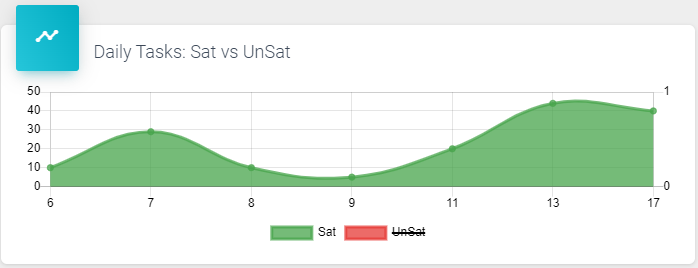
The next chart we will explore is the "Daily Tasks: Sat vs UnSat".
This chart shows the daily Tasks that were completed for "Sat", or Satisfactory, shown in Green, and "UnSat", or Unsatisfactory, shown in Red.
Again, hovering over the datapoint will display the details of the information represented.
Also, represented in the chart is the Legend showing what each color represents. Try clicking "Sat" or "UnSat" to see the chart filtered.
Note that this is a feature across any report that includes a Legend.
Top 10 is a pretty common part of reporting to help surface information of interest.
Here we are looking at the "Top 10 Users" bar chart.
This represents the Users who have completed the most Scans for the period of the report.
Hovering over the bar chart will display the User and the exact number of Scans they completed.
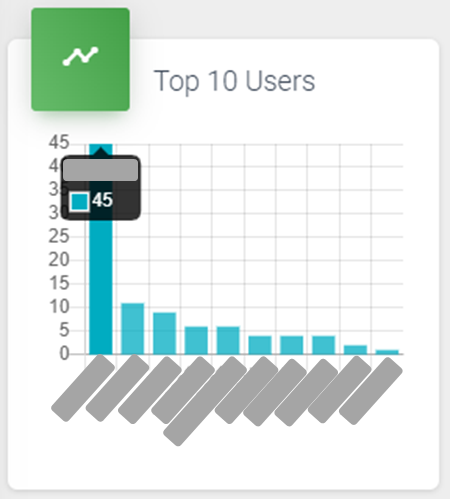
The area labeled "MRC Records for..." followed by a single date, or a date range, displays the aggregate information for each Scan completed for the period of the report.
Here is a definition of each of the fields, or columns, that appear in this table of information:
- Scan ID - When an item is created within the system it is given a unique number. That is what the scan id is.
- Zone - Multiple areas, or Architectural Numbers, can be assigned to a Zone. Click the Zone to see a report showing the Architectural Numbers and Areas within that Zone and performance over a period of time.
- Architectural # - Click the Architectural Number to see a report for that area.
- Sat - The number of Tasks or Checks for an area that were marked 'Sat'
- UnSat - The number of Tasks or Checks for an area that were marked 'UnSat'
- Image - Was an image attached by the user? If so, the kind of image will be displayed.
- Check By - This is who did the check. Click the value to see a report for that user.
- Timestamp - This is the last time this item was checked. Click the date to see the activity on that day.
- Action - Click 'View' to see the entries for the scan, including the image, if attached.
Here is a tip for using this table, and numerous other tables, within the system.
Try hovering your mouse over the question mark icon, . A tooltip will appear to help let you know what else you can do from there.
MRC – Reporting – User Report
The most common way to get to the “MRC User Reporting” is to click on the “Check By” value within another report. Including the “Scan List” page.
MRC User Reporting
Here you will see the reporting for a particular User for the period of the report.
This combines the multi-day selection process with the entry of a Check By value.
To update the report, perform the following steps:
- Click in the field next to the “Start” and select a new date from the calendar pop-up, or type the new date in manually
- Click in the field next to the “End” and select a new date from the calendar pop-up, or type the new date in manually
- In the “Check By” field, enter the ID of the User that you like to report on
- Generally this is the Employees Company ID, but can be initials, name, or other identifier as typed by the person completing the scan. The key is to have your users be consistent with what they enter.
- Click “Update Report”


Notice, too, that when hovering your mouse, or clicking the field brings up a tooltip to help explain the purpose of the field. This is present in most locations around the system and products.
Various reports will include a daily view within MRC. Below are a couple of the charts that you will come across when looking at reports that include the daily, aggregated, view.
The first chart is the "Daily Scans".
This is the number scans done by day for the period of the report.
Hovering over a datapoint will bring up the quantity of "Scans" for that date.
The next chart we will explore is the "Daily Tasks: Sat vs UnSat".
This chart shows the daily Tasks that were completed for "Sat", or Satisfactory, shown in Green, and "UnSat", or Unsatisfactory, shown in Red.
Again, hovering over the datapoint will display the details of the information represented.
Also, represented in the chart is the Legend showing what each color represents. Try clicking "Sat" or "UnSat" to see the chart filtered.
Note that this is a feature across any report that includes a Legend.
Top 10 is a pretty common part of reporting to help surface information of interest.
Here we are looking at the "Top 10 Users" bar chart.
This represents the Users who have completed the most Scans for the period of the report.
Hovering over the bar chart will display the User and the exact number of Scans they completed.
The area labeled "MRC Records for..." followed by a single date, or a date range, displays the aggregate information for each Scan completed for the period of the report.
Here is a definition of each of the fields, or columns, that appear in this table of information:
- Scan ID - When an item is created within the system it is given a unique number. That is what the scan id is.
- Zone - Multiple areas, or Architectural Numbers, can be assigned to a Zone. Click the Zone to see a report showing the Architectural Numbers and Areas within that Zone and performance over a period of time.
- Architectural # - Click the Architectural Number to see a report for that area.
- Sat - The number of Tasks or Checks for an area that were marked 'Sat'
- UnSat - The number of Tasks or Checks for an area that were marked 'UnSat'
- Image - Was an image attached by the user? If so, the kind of image will be displayed.
- Check By - This is who did the check. Click the value to see a report for that user.
- Timestamp - This is the last time this item was checked. Click the date to see the activity on that day.
- Action - Click 'View' to see the entries for the scan, including the image, if attached.
Here is a tip for using this table, and numerous other tables, within the system.
Try hovering your mouse over the question mark icon, . A tooltip will appear to help let you know what else you can do from there.
MRC – Reporting – Zone Report
The most common way to get to the “MRC Zone Reporting” is to click on the “Zone” value within another report. Including the “Scan List” page.
Even if the Zone is showing as “unclassified” (the default if no Zone is provided), clicking it will get you into the report and you can change the Zone, outlined below.
MRC Zone Reporting
Here you will see the reporting for a particular Zone for the period of the report.
Within the "MRC Zone Reporting" you will have the option to report by day for each Zone.
This combines the usual Date Range selection with a Zone selection dropdown.
You can change dates by clicking in the field next to the date you want to change, then selecting a new date from the calendar, or typing the new date in manually.
After updating the dates, and selecting the Zone, click "Update Report".
Notice, too, that when hovering your mouse, or clicking the field brings up a tooltip to help explain the purpose of the field. This is present in most locations around the system and products.
Various reports will include a daily view within MRC. Below are a couple of the charts that you will come across when looking at reports that include the daily, aggregated, view.
The first chart is the "Daily Scans".
This is the number scans done by day for the period of the report.
Hovering over a datapoint will bring up the quantity of "Scans" for that date.
The next chart we will explore is the "Daily Tasks: Sat vs UnSat".
This chart shows the daily Tasks that were completed for "Sat", or Satisfactory, shown in Green, and "UnSat", or Unsatisfactory, shown in Red.
Again, hovering over the datapoint will display the details of the information represented.
Also, represented in the chart is the Legend showing what each color represents. Try clicking "Sat" or "UnSat" to see the chart filtered.
Note that this is a feature across any report that includes a Legend.
Top 10 is a pretty common part of reporting to help surface information of interest.
Here we are looking at the "Top 10 Users" bar chart.
This represents the Users who have completed the most Scans for the period of the report.
Hovering over the bar chart will display the User and the exact number of Scans they completed.
The area labeled "MRC Records for..." followed by a single date, or a date range, displays the aggregate information for each Scan completed for the period of the report.
Here is a definition of each of the fields, or columns, that appear in this table of information:
- Scan ID - When an item is created within the system it is given a unique number. That is what the scan id is.
- Zone - Multiple areas, or Architectural Numbers, can be assigned to a Zone. Click the Zone to see a report showing the Architectural Numbers and Areas within that Zone and performance over a period of time.
- Architectural # - Click the Architectural Number to see a report for that area.
- Sat - The number of Tasks or Checks for an area that were marked 'Sat'
- UnSat - The number of Tasks or Checks for an area that were marked 'UnSat'
- Image - Was an image attached by the user? If so, the kind of image will be displayed.
- Check By - This is who did the check. Click the value to see a report for that user.
- Timestamp - This is the last time this item was checked. Click the date to see the activity on that day.
- Action - Click 'View' to see the entries for the scan, including the image, if attached.
Here is a tip for using this table, and numerous other tables, within the system.
Try hovering your mouse over the question mark icon, . A tooltip will appear to help let you know what else you can do from there.
MRC Scans List Page
The Scans List in MRC is a good source of information and a great location for jumping deeper into MRC.
Below we will deep dive into the various features and functionality possible from the Scans List page.
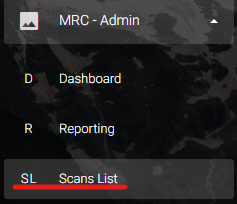
You can access this page from the navigation bar by expanding the "MRC - Admin" menu, then click "Scans List".
Standard User accounts do not have access to the Scans List. If you do not see "Scans List", and believe that you should, please let us know. We will work with your company contact to ensure appropriate permissions.

The "MRC Scans List" is a list of all the active "Scans" that have been loaded into the Management Rounds Check system.
The fields available are:
- Scan ID - When an item is created within the system it is given a unique number. That is what the scan id is.
- Zone - Multiple areas, or Architectural Numbers, can be assigned to a Zone. Click the Zone to see a report showing the Architectural Numbers and Areas within that Zone and performance over a period of time.
- Architectural # - Click the Architectural Number to see a report for that area.
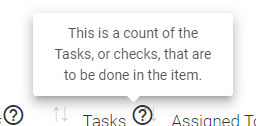
- Tasks - This is a count of the Tasks, or checks, that are to be done in the item.
- Assigned To - An item can be assigned to a specific user, shown here. Click the value in the Assigned To column to see a report for that user.
- Timestamp - This is the last time this item was checked. Click the date to see the activity on that day.
- Actions - Click 'Edit' to change the tasks, or checks, for an item, add notes or change the assignment. Click 'Delete' to delete the item from the list.
MRC Scans List Tips and Tricks
- Clicking the arrows at the top of any column will sort the column:

- Hover your mouse over the question mark icon, , for tooltip pop-ups:
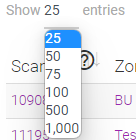
- Use the "Show ## entries" drop down menu to show more or less entries:
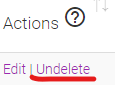
- If you "Delete" a record by accident, you can "Undelete" it using "Show Deleted":

- Use "Search" to find records faster:

Deleting and Undeleting Scans in MRC
There are times that you will want to remove a Scan from rotation.
Maybe it is an area that is no longer needing the attention. Maybe it is no longer used. Maybe the Scan was accidental. There are a number of reasons to remove a Scan.
In this article we will explain how to Delete the Scan and how to Undelete it, if needed.
You can access this page from the navigation bar by expanding the "MRC - Admin" menu, then click "Scans List".
Standard User accounts do not have access to the Scans List. If you do not see "Scans List", and believe that you should, please let us know. We will work with your company contact to ensure appropriate permissions.
Deleting a Scan
- From the navigation bar, expand the "MRC - Admin" menu, then click "Scans List"
- From the "MRC Scans List" locate the record you would like to edit.
- Using "Search" in the upper right of the table will filter any field for the query
- Once you have located the record you would like to delete, click "Delete"
- It will no longer appear in the Scans List
- This does not eliminate the record from the database but marks it as inactive and it will no longer show in the "MRC Scans List"
- If the barcode, or QR code, is still physically in place it is possible for a user to scan the code
Undeleting a Scan
- From the navigation bar, expand the "MRC - Admin" menu, then click "Scans List"
- From the "MRC Scans List" click "Show Deleted"
- In the Deleted list, locate the record you would like to edit, or "Undelete"
- Using "Search" in the upper right of the table will filter any field for the query
- Once you have located the record you would like to recover, click " Undelete"
- This marks the record as active and it will appear in the "MRC Scans List" again
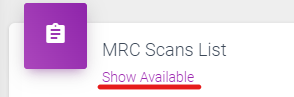
- Click "Show Available" to navigate back to the list of active Scans
Data Out of Date?
There are times that you upload a spreadsheet, have conducted some scans, or otherwise had some activity that you feel should be visible in the system.
This could be a report that seems to be delayed, a scan list that is missing the records you just added, or an Export that doesn't have all the barcodes, or QR codes, available.
This generally occurs because of a feature in browsers called caching. In this process the site, or page, is temporarily stored in the memory of the browser. The result can be that you are seeing the page stored in your browsers cache rather than the live page.
There are number of ways to refresh the page:
- The simplest way to help is by clicking the "Reload Content" button that is available on each page, for exactly this purpose.

- The other option is to click the "Refresh" button in your browser.

- You can also press the "F5" key on your keyboard while on the page you would like to refresh.
- For really tough ones, you can hold the "ctrl", or control, key on your keyboard then press "F5".
- Then try logging out and back in.
If all else fails, contact us for assistance. We wouldn't want you to manually clear your browser cache and history unnecessarily.
Adding Scans in MRC

Before you can start tracking, collecting and reporting on anything, you have to get some scans into the system.
Standard User accounts do not have access to create Scans. If you do not see "Add 1 New Scan" or "Bulk Add Scans", and believe that you should, please let us know. We will work with your company contact to ensure appropriate permissions.
There are two ways to add Scans. You can either add them one at a time or you can load them in bulk.
From the navigation bar, expand the menu, then click "Add 1 New Scan" to create one scan at a time, or click the "Bulk Add Scans" to load several at once.
We will detail both options below.
If you see a term that is unfamiliar, please see Terminology of MRC for MRC specific terminology.
Add 1 New Scan
- From the navigation bar, expand the "MRC - Admin" menu, then click "Add 1 New Scan"
- Enter the values for the Scan you would like to add
- Assigned To = You can assign the Scan to a User if you would like. It is optional and you will need to know the Users id in the system to add them.
- Zone = The “Zone” where the room or area of the facility is located. This reporting feature can be useful when grouping tasks and scans based on a wing of a hospital, for example.
- Architectural Number = The Architectural Number is the name of the room, or area, where the task is to take place. Some Architectural Number examples would be “OR Room 1”, “Pediatrics Bays”, or “Surgery/Trauma”.
- Task 1 - Task 25 = The item, or task, that is to be checked in the room or location. Essentially, the tasks are the checklist to be done after each scan.
- Click "Create Scan" to add the record to the system
- Once the Scan has been added, it is available to print through "Export Scans"
Bulk Add Scans
- From the navigation bar, expand the menu, then click "Bulk Add Scans"
- Download a fresh template using the "Download" button, if you already have the template you can skip this step.
- Fill in the template with as many new Scans as you would like. There are several columns in the template:
- zone_name = The Zone where the room or area of the facility is located
- room_id = The Architectural Number, area, or room where the duty or task is to take place
- step_1_name - step_25_name = The tasks that should be checked, up to 25 per Scan, or row
- company_abbr = This is the abbreviation for your company account
- Save the completed template to your local system
- Click the "Choose File" button and locate the template that you just saved
- Click "Upload"
- Once the Scans have been loaded, they are available to print through "Export Scans"
Troubleshooting Bulk Add Scans
If you are unable to find the Scan that you added to the system please check the following. These are the most common reasons a Scan does not show:
- Refresh the page. Sometimes the page gets cached in the browser and may not display the most recent scans.
- Incorrect value in the "company_abbr" field.
- Correct "company_abbr" value but it is in the wrong column. For example, if I put "dhcs" (my company_abbr) in the "step_25_name" column, it will not show in my account.
- If the file fails to upload, please make sure the file is saved as a .csv. It is always a good idea to download a fresh copy of the template as the fields may have changed.
Editing a Scan in MRC

Sometimes the Tasks needed for a particular Architectural ID, or Area, change. Sometimes there is a typo.
There is a way to make changes to individual Scans after they are in the system.
NOTE: This does not change the Tasks that were already completed, only the Tasks that will be completed in the future.
Standard User accounts do not have access to edit Scans. If you do not see "Scans List", and believe that you should, please let us know. We will work with your company contact to ensure appropriate permissions.
To Edit a Scan in MRC:

- From the navigation bar, expand the "MRC - Admin" menu, then click "Scans List"
- From the "MRC Scans List" locate the record you would like to edit.
- Using "Search" in the upper right of the table will filter any field for the query
- Once you have located the record you would like to edit, click "Edit"
- Clicking "Delete" will remove the record from active scans but can still be recovered using the "Show Deleted" at the top of the page.
- The current Task information will load in a form
- Make changes to any of the following
- Assigned To = You can assign the Scan to a User if you would like. It is optional and you will need to know the Users id in the system to add them.
- Zone = The “Zone” where the room or area of the facility is located. This reporting feature can be useful when grouping tasks and scans based on a wing of a hospital, for example.
- Architectural Number = The Architectural Number is the name of the room, or area, where the task is to take place. Some Architectural Number examples would be “OR Room 1”, “Pediatrics Bays”, or “Surgery/Trauma”.
- Task 1 - Task 25 = The item, or task, that is to be checked in the room or location. Essentially, the tasks are the checklist to be done after each scan.
- Notes = These notes will load into the Scan and appear to the user that scans the Barcode/QR Code
- Click "Update Scan" to save the changes
The next time a user scans the Barcode/QR Code for this Scan the changes that were made will load for them and attach to the completed scan
Creating a Barcode or QR Code in MRC

Once you have loaded your scans into the system, you will need a barcode, or QR code, to scan.
Luckily, this is one of the easiest parts.
After loading the scans, or adding them one by one, the barcode/QR code is available automatically.
Simply view them through the "Export Scans" process.
Standard User accounts do not have access to create barcodes, or QR codes. If you do not see "Export Scans", and believe that you should, please let us know. We will work with your company contact to ensure appropriate permissions.
Exporting and Printing Scans in MRC (v3.1.1)

After the Scans have been loaded into the system, they are ready to be printed and placed around the facility.
Once the barcodes, also known as QR Codes, are in place they are ready for scanning and reporting. Many devices include a barcode scanner on the camera, but if not, any "Barcode" or "QR Code" reader app will work.
Standard User accounts do not have access to Export Scans. If you do not see "Export Scans", and believe that you should, please let us know. We will work with your company contact to ensure appropriate permissions.
From the navigation bar, expand the menu, then click "Export Scans" to load the MRC Scans List.
We will detail both options below.
How to Export Scans - Print Full Page
- From the navigation bar, expand the menu and click "Export Scans"
- There is also a shortcut from the "Bulk Add Scans" page, just click the "Bulk Export" button there
- Click the "Browser Print" option next to "Print Options"
- When printing from Chrome it may be necessary to expand 'More Settings' then check the box under Options for "Background Graphics"
- A full page of the scans to print will open, click the button
- Select your printer and click "Print"
- Once printed, cut each code out and place them in the applicable location, or area
- Note: By default, the most recent 20 Scans loaded into the system will display
- You can show more by clicking the "Show 100..." to show the most recent 100 Scans, 200 for the most recent 200, and so on. The follow the steps above to print.
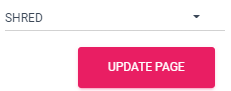
- You can filter the page to show specific Zones by clicking "Select a Zone", selecting the Zone, and then clicking "Update Page"
- You can show more by clicking the "Show 100..." to show the most recent 100 Scans, 200 for the most recent 200, and so on. The follow the steps above to print.

How to Export Scans - Download, and/or Print, a PDF File
- From the navigation bar, expand the menu and click "Export Scans"
- There is also a shortcut from the "Bulk Add Scans" page, just click the "Bulk Export" button there
- Click the "PDF Print or Download" option next to "Print Options"
- Please note that the PDF option is available for 50, or less, scans due to the time it takes for the file to be created
- A new page that contains the PDF file will open
- Print is available from the icon

- If "Print" is selected, you will want to select your printer and click "Print"
- Download is available from the icon

- If "Download" is selected, you will want to name your file and choose the applicable location on your computer to save it for printing later
- Once printed, cut each code out and place them in the applicable location, or area
- Note: By default, the most recent 20 Scans loaded into the system will display
- You can show more by clicking the "Show 100..." to show the most recent 100 Scans, 200 for the most recent 200, and so on. The follow the steps above to print.
How to Export Scans - Using a Word Processor (such as Word)
- From the navigation bar, expand the menu and click "Export Scans"
- There is also a shortcut from the "Bulk Add Scans" page, just click the "Bulk Export" button there
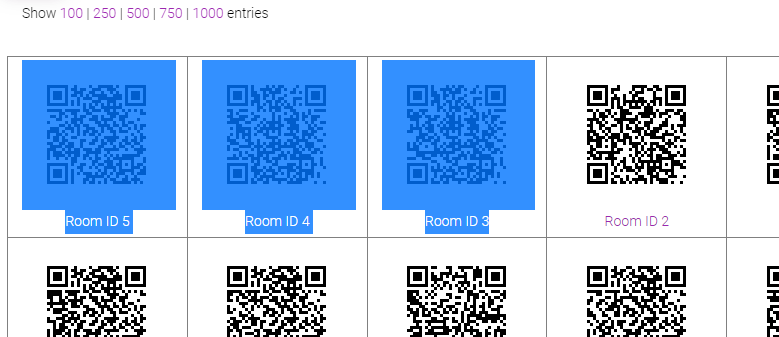
- Highlight the codes on the page by clicking your mouse above the first scan that you want to print. Then drag, while holding down your mouse button, down to the last scan that you want to print.
- In this example, I would be selecting the first three Scans only, but this can work for any number of Scans.
- Copy the scans to your clipboard
- Press the keys "ctrl" and "c" on your keyboard to copy
- Press the keys "control" and "c" on your keyboard to copy
- Right-click your mouse in the highlighted area and choose "Copy"
- Open a blank Word, or other Word Processing program, and paste in the contents from your clipboard
- Press the keys "ctrl" and "v" on your keyboard to copy
- Press the keys "control" and "v" on your keyboard to copy
- Right-click your mouse in the highlighted area and choose "Paste"
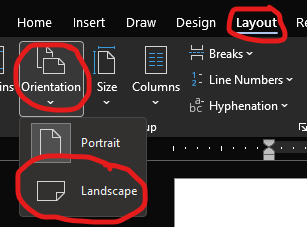
- HINT: Depending on the number of Scans you are trying to print, it may be necessary to change the layout of the page to horizontal
- Print from the word processor page
- Once printed, cut each code out and place them in the applicable location, or area
- Note: By default, the most recent 20 Scans loaded into the system will display
- You can show more by clicking the "Show 100..." to show the most recent 100 Scans, 200 for the most recent 200, and so on. The follow the steps above to print.
Scanning a Barcode or QR Code in MRC
Once the barcodes, also known as QR Codes, are in place they are ready for scanning and reporting.
Most devices include a barcode scanner on the camera by default, but if not, any "Barcode" or "QR Code" reader app will work. All these devices are supported out of the box. No extra hardware or software needed.
Your device will need an internet connection. Any decent stable WiFi connection or mobile carrier will work.
Scanning the Barcode or QR Code:
- Open the reader app on your device
- This can be the camera with QR code reader built-in or any standalone, free, Barcode/QR Code reader app
- Allow the app to scan the code which will open the default browser on your device
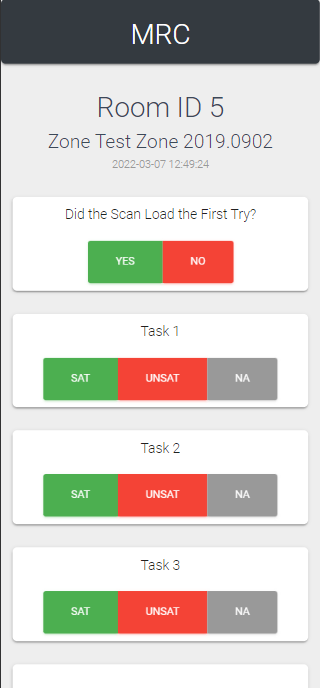
- Complete the Tasks listed, marking them as "SAT", "UNSAT", or "NA" if it is not applicable
- Add "Notes" if needed
- Enter your "Employee ID Number"
- Click "Submit"
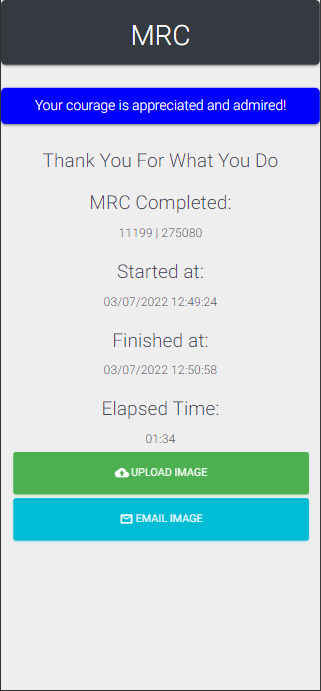
- You can be done here, or proceed to upload an image
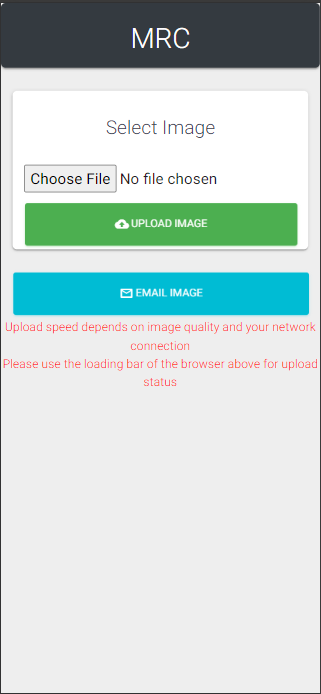
- Top upload, click the "Upload Image" button
- Click "Choose File", this will open a dialog on your device
- Take a new photo (this is the most common)
- Select an image from your device
- Click "Upload Image" to send the image to the system and attach it to the scan
- Alternatively, you can "Email Image" to open your default email application. This will automatically add the Scan ID, record and image to an email with the correct destination email address.
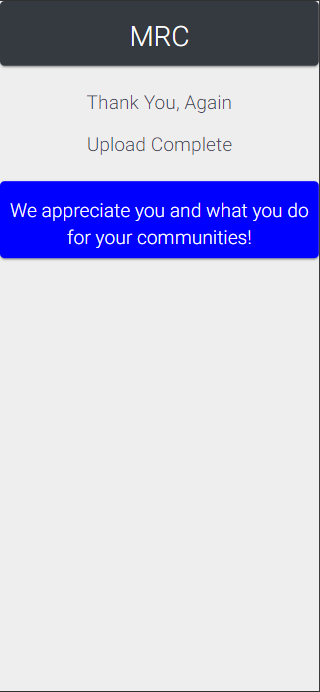
- Once you receive the "Upload Complete" message, you are finished uploading and attaching the image to the scan
Below are some screen shots of example screens from the mobile scan.
- The Task List
- Tasks Completed
- Upload Option
- Upload Complete