There are a number of ways to get to the MRC Reporting by Day, or Date Range.
Some of the most common are as follows:
- Clicking “Todays Report” from the navigation bar
- Clicking “Last 7 Days”, or variation of Last # Days, from the navigation bar
- Clicking a date, or date and timestamp, from different reporting tables
- Including the “Scan List” page.
MRC Single Day Reporting
Here you will see reporting for a single day. Hourly total scans as well as Sat and UnSat by hour.
The Top 10 Users shows the 10 users with the most scans for the day.
Want another day? Simply select or enter a different value in the “Date Selection” box and press “Update Report”.
As you use different reports across the system you may need to select a custom date, or date range. There are plenty of places that will quick link you to a date, such as "Today", or last 7 days, but there are times when you need something a little more specific of precise.
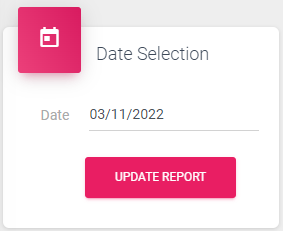
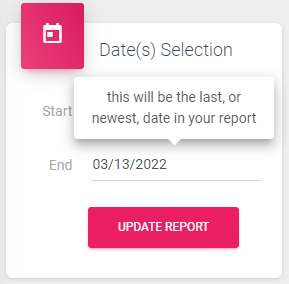
First, we will look at the "Date Selection".
This will allow you to choose one, single, day and is usually combined with reports that are at the hourly level.
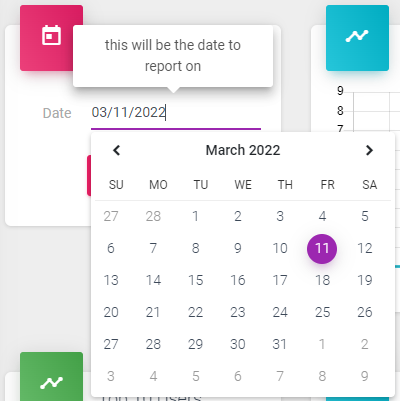
Simply click in the "Date" field and either select the date from the calendar that pops out or type the date into the field.
After updating the date, click "Update Report".
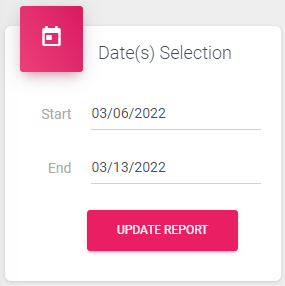
MRC Multi-Day, or Date Range, Reporting
Next, we will look at the multi-day selection process.
This is generally paired with reports that show a daily grain of reporting.
By default this report will select dates associated with the navigation selections. For example, if you click the "Last 7 Days" link, it would start on the date from a week ago, and end on todays date.
You can change those dates by clicking in the field next to the date you want to change, then selecting a new date from the dropdown, or typing the new date in manually.
After updating the dates, click "Update Report".
Notice, too, that when hovering your mouse, or clicking the field brings up a tooltip to help explain the purpose of the field. This is present in most locations around the system and products.
Various reports will include an hourly view to them in MRC. Below are a couple of the charts that you will come across when looking at reports that include an hourly view.
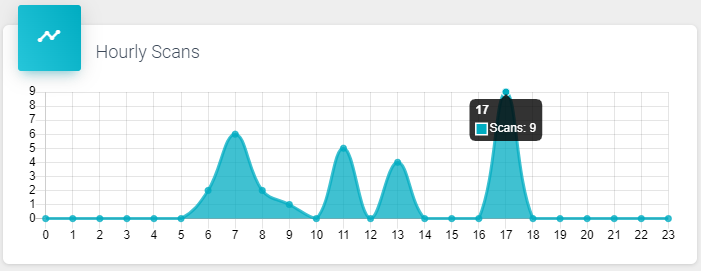
The first chart is the "Hourly Scans".
This shows the number scans done by hour for the period of the report.
Hovering over a datapoint will bring up the quantity of "Scans" for that hour.
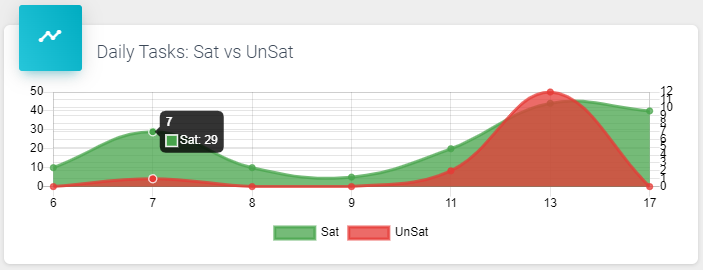
The next chart we will explore is the "Hourly Tasks: Sat vs UnSat".
This chart shows the hourly Tasks that were completed for "Sat", or Satisfactory, shown in Green, and "UnSat", or Unsatisfactory, shown in Red.
Again, hovering over the datapoint will display the details of the information represented.
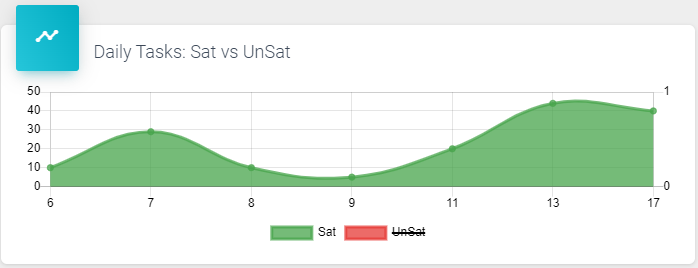
Also, represented in the chart is the Legend showing what each color represents. Try clicking "Sat" or "UnSat" to see the chart filtered.
Note that this is a feature across any report that includes a Legend. 
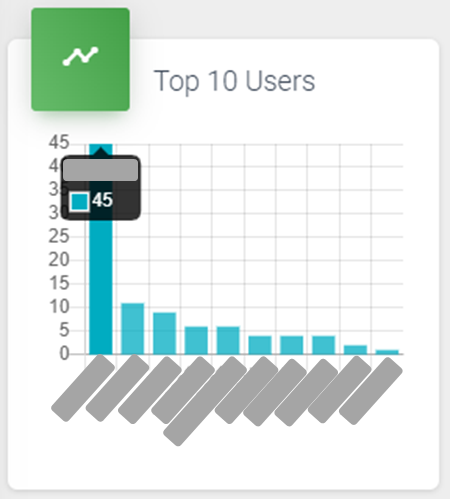
Top 10 is a pretty common part of reporting to help surface information of interest.
Here we are looking at the "Top 10 Users" bar chart.
This represents the Users who have completed the most Scans for the period of the report.
Hovering over the bar chart will display the User and the exact number of Scans they completed.
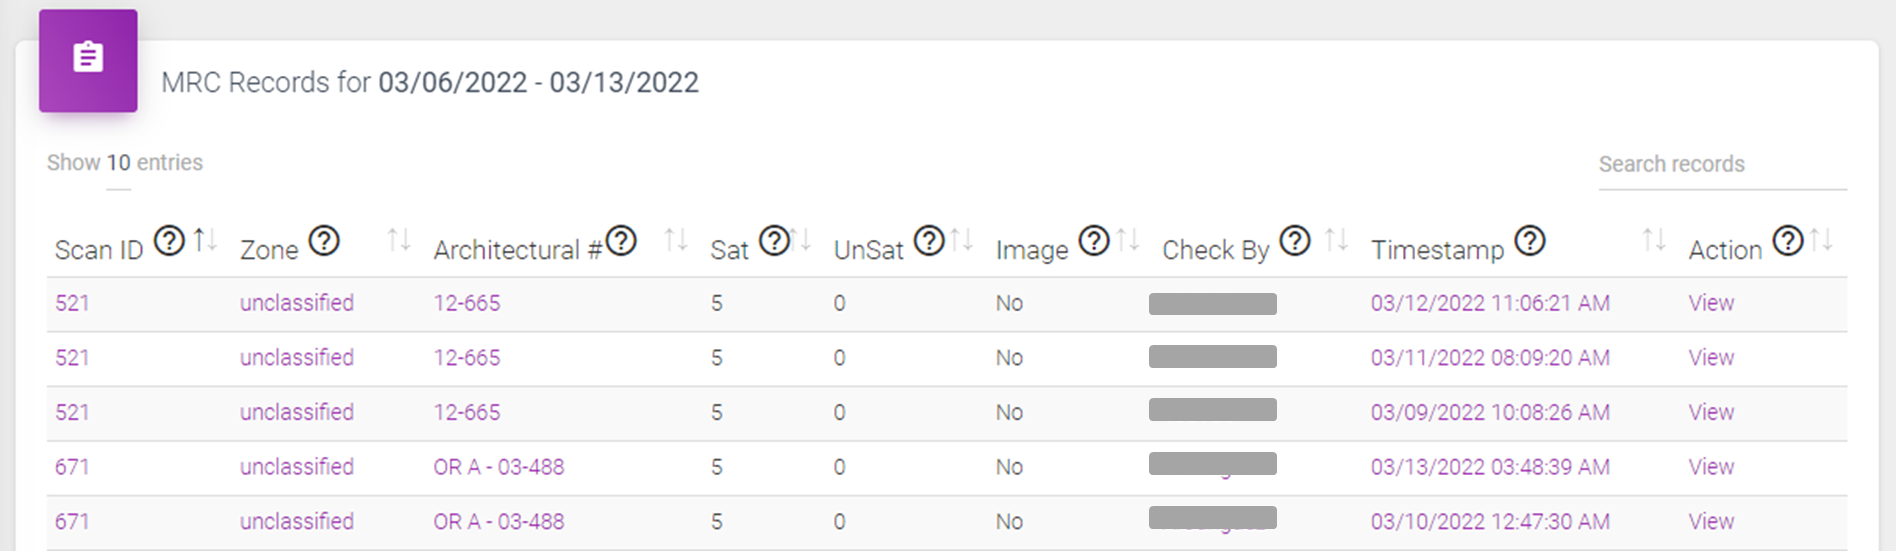
The area labeled "MRC Records for..." followed by a single date, or a date range, displays the aggregate information for each Scan completed for the period of the report.
Here is a definition of each of the fields, or columns, that appear in this table of information:
- Scan ID - When an item is created within the system it is given a unique number. That is what the scan id is.
- Zone - Multiple areas, or Architectural Numbers, can be assigned to a Zone. Click the Zone to see a report showing the Architectural Numbers and Areas within that Zone and performance over a period of time.
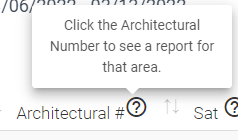
- Architectural # - Click the Architectural Number to see a report for that area.
- Sat - The number of Tasks or Checks for an area that were marked 'Sat'
- UnSat - The number of Tasks or Checks for an area that were marked 'UnSat'
- Image - Was an image attached by the user? If so, the kind of image will be displayed.
- Check By - This is who did the check. Click the value to see a report for that user.
- Timestamp - This is the last time this item was checked. Click the date to see the activity on that day.
- Action - Click 'View' to see the entries for the scan, including the image, if attached.
Here is a tip for using this table, and numerous other tables, within the system.
Try hovering your mouse over the question mark icon,  . A tooltip will appear to help let you know what else you can do from there.